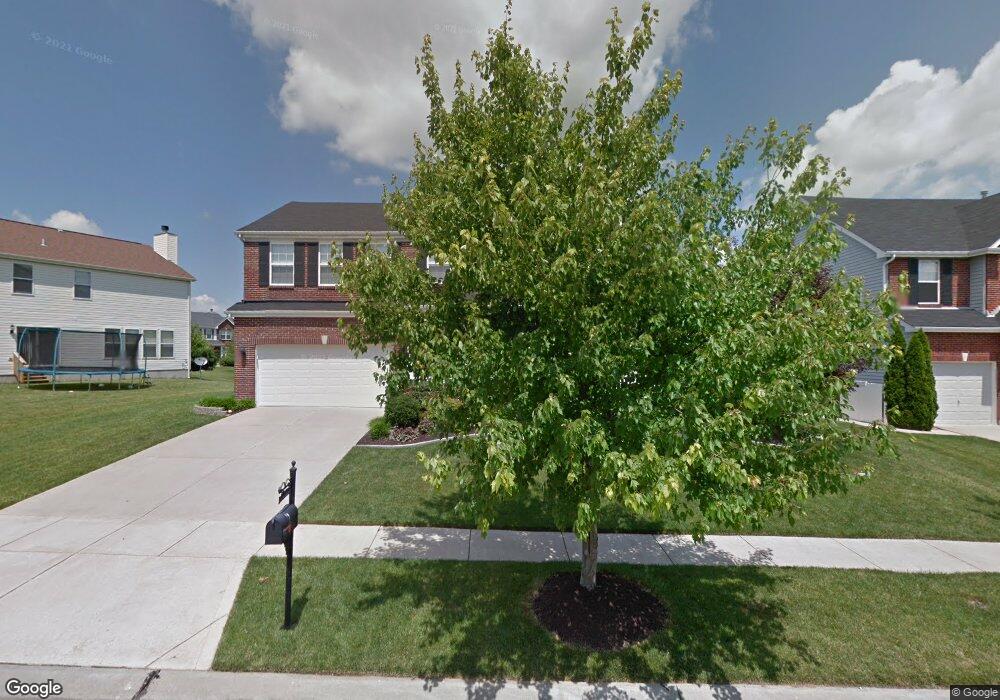
772 Cypress Knoll Dr O Fallon, MO 63368
Estimated Value: $493,588 - $531,000
4
Beds
4
Baths
3,092
Sq Ft
$166/Sq Ft
Est. Value
About This Home
This home is located at 772 Cypress Knoll Dr, O Fallon, MO 63368 and is currently estimated at $512,397, approximately $165 per square foot. 772 Cypress Knoll Dr is a home located in St. Charles County with nearby schools including Crossroads Elementary School, Frontier Middle School, and Liberty High School.
Ownership History
Date
Name
Owned For
Owner Type
Purchase Details
Closed on
Sep 4, 2007
Sold by
Brueggemann James and Brueggemann Laura
Bought by
Kerns Dennis K and Kerns Debra L
Current Estimated Value
Home Financials for this Owner
Home Financials are based on the most recent Mortgage that was taken out on this home.
Original Mortgage
$165,000
Outstanding Balance
$105,267
Interest Rate
6.72%
Mortgage Type
Purchase Money Mortgage
Estimated Equity
$407,130
Purchase Details
Closed on
Dec 16, 1999
Sold by
The Jones Company Custom Homes Inc
Bought by
Brueggeman James E and Brueggeman Laura E
Home Financials for this Owner
Home Financials are based on the most recent Mortgage that was taken out on this home.
Original Mortgage
$201,811
Interest Rate
7.71%
Mortgage Type
Seller Take Back
Create a Home Valuation Report for This Property
The Home Valuation Report is an in-depth analysis detailing your home's value as well as a comparison with similar homes in the area
Home Values in the Area
Average Home Value in this Area
Purchase History
| Date | Buyer | Sale Price | Title Company |
|---|---|---|---|
| Kerns Dennis K | $314,900 | None Available | |
| Brueggeman James E | -- | -- |
Source: Public Records
Mortgage History
| Date | Status | Borrower | Loan Amount |
|---|---|---|---|
| Open | Kerns Dennis K | $165,000 | |
| Previous Owner | Brueggeman James E | $201,811 |
Source: Public Records
Tax History Compared to Growth
Tax History
| Year | Tax Paid | Tax Assessment Tax Assessment Total Assessment is a certain percentage of the fair market value that is determined by local assessors to be the total taxable value of land and additions on the property. | Land | Improvement |
|---|---|---|---|---|
| 2025 | $5,347 | $82,088 | -- | -- |
| 2023 | $5,351 | $78,249 | $0 | $0 |
| 2022 | $4,982 | $67,923 | $0 | $0 |
| 2021 | $4,993 | $67,923 | $0 | $0 |
| 2020 | $4,479 | $58,498 | $0 | $0 |
| 2019 | $4,204 | $58,498 | $0 | $0 |
| 2018 | $4,141 | $54,826 | $0 | $0 |
| 2017 | $4,115 | $54,826 | $0 | $0 |
| 2016 | $3,614 | $46,180 | $0 | $0 |
| 2015 | $3,560 | $46,180 | $0 | $0 |
| 2014 | $2,990 | $41,590 | $0 | $0 |
Source: Public Records
Map
Nearby Homes
- 107 Wake Forest Dr
- 112 Wake Forest Place
- 6998 Route N
- 702 Balcarra Dr
- 701 Balcarra Dr
- 318 Copper Tree Ct
- 258 Chestnut Hill Dr
- 612 Thornridge Dr
- 7767 Boatside Dr
- 7797 Boatside Dr
- 113 Salfen Farm Ct
- 223 Falcon Hill Dr
- 10 Pine Cone Ct
- 950 Promenade Ct
- 1428 Kearney Dr
- Rosemont Plan at Cedarstone - Heritage Collections
- Windsor Plan at Cedarstone - Heritage Collections
- Davenport Plan at Cedarstone - Heritage Collections
- Sierra Universal Design Plan at Cedarstone - Heritage Collections
- Lancaster Plan at Cedarstone - Heritage Collections
- 774 Cypress Knoll Dr
- 1014 Red Orchard Trail
- 1012 Red Orchard Trail
- 403 Cypress Knoll Ct
- 1010 Red Orchard Trail
- 773 Cypress Knoll Dr
- 775 Cypress Knoll Dr
- 771 Cypress Knoll Dr
- 1008 Red Orchard Trail
- 1015 Red Orchard Trail
- 769 Cypress Knoll Dr
- 777 Cypress Knoll Dr
- 405 Cypress Knoll Ct
- 766 Cypress Knoll Dr
- 1011 Red Orchard Trail
- 776 Cypress Knoll Dr
- 765 Cypress Knoll Dr
- 1009 Red Orchard Trail
- 1006 Red Orchard Trail
- 779 Cypress Knoll Dr