Estimated Value: $402,000 - $419,000
5
Beds
3
Baths
2,899
Sq Ft
$141/Sq Ft
Est. Value
About This Home
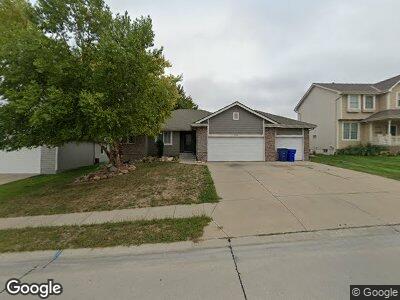
This home is located at 7721 S 167th St, Omaha, NE 68136 and is currently estimated at $408,903, approximately $141 per square foot. 7721 S 167th St is a home located in Sarpy County with nearby schools including Upchurch Elementary School, Harry Andersen Middle School, and Millard South High School.
Ownership History
Date
Name
Owned For
Owner Type
Purchase Details
Closed on
Apr 25, 2024
Sold by
Vogel Ronald E and Vogel Nancy A
Bought by
Vogel Living Trust and Vogel
Current Estimated Value
Purchase Details
Closed on
Aug 10, 2011
Sold by
Fannie Mae
Bought by
Gracie Properties Llc
Purchase Details
Closed on
May 18, 2011
Sold by
Peeks David L and Peeks Jamie L
Bought by
Federal National Mortgage Association
Purchase Details
Closed on
Aug 6, 2003
Sold by
Fools Inc
Bought by
Peeks David L and Peeks Jamie L
Home Financials for this Owner
Home Financials are based on the most recent Mortgage that was taken out on this home.
Original Mortgage
$143,960
Interest Rate
4.5%
Purchase Details
Closed on
Jan 7, 2003
Sold by
Dodge Land Co
Bought by
Fools Inc
Home Financials for this Owner
Home Financials are based on the most recent Mortgage that was taken out on this home.
Original Mortgage
$135,000
Interest Rate
6.06%
Create a Home Valuation Report for This Property
The Home Valuation Report is an in-depth analysis detailing your home's value as well as a comparison with similar homes in the area
Home Values in the Area
Average Home Value in this Area
Purchase History
| Date | Buyer | Sale Price | Title Company |
|---|---|---|---|
| Vogel Living Trust | -- | None Listed On Document | |
| Gracie Properties Llc | -- | Nlta | |
| Federal National Mortgage Association | $157,960 | None Available | |
| Peeks David L | $180,000 | Allegiance Title Company | |
| Fools Inc | $28,000 | -- |
Source: Public Records
Mortgage History
| Date | Status | Borrower | Loan Amount |
|---|---|---|---|
| Previous Owner | Gracie Propertes Llc | $202,625 | |
| Previous Owner | Peeks David L | $66,000 | |
| Previous Owner | Peeks David L | $143,960 | |
| Previous Owner | Fools Inc | $135,000 | |
| Closed | Peeks David L | $35,990 |
Source: Public Records
Tax History Compared to Growth
Tax History
| Year | Tax Paid | Tax Assessment Tax Assessment Total Assessment is a certain percentage of the fair market value that is determined by local assessors to be the total taxable value of land and additions on the property. | Land | Improvement |
|---|---|---|---|---|
| 2024 | $5,710 | $348,822 | $54,000 | $294,822 |
| 2023 | $5,710 | $300,010 | $48,000 | $252,010 |
| 2022 | $5,687 | $279,150 | $42,000 | $237,150 |
| 2021 | $5,468 | $255,394 | $42,000 | $213,394 |
| 2020 | $5,551 | $250,441 | $36,000 | $214,441 |
| 2019 | $5,614 | $239,802 | $36,000 | $203,802 |
| 2018 | $5,360 | $222,015 | $32,000 | $190,015 |
| 2017 | $5,311 | $217,596 | $27,000 | $190,596 |
| 2016 | $5,064 | $206,304 | $27,000 | $179,304 |
| 2015 | $4,912 | $199,094 | $27,000 | $172,094 |
| 2014 | $4,895 | $197,896 | $27,000 | $170,896 |
| 2012 | -- | $195,808 | $27,000 | $168,808 |
Source: Public Records
Map
Nearby Homes
- 16543 Willow St
- 7714 S 167th St
- 16516 Willow St
- 16510 Redwood St
- 16528 Briar St
- 8019 S 167th St
- 7812 S 171st St
- 16443 Briar St
- 8114 S 167th St
- 16831 Chandler St
- 7664 S 162nd St
- 16212 Timberlane Dr
- 16305 Rosewood St
- 7849 S 162nd St
- 7509 S 170th St
- 7311 S 171st St
- 16207 Josephine St
- 16864 Virginia St
- 16912 Virginia St
- 7021 S 163rd St
- 7721 S 167th St
- 7717 S 167th St
- 7725 S 167th St
- 7713 S 167th St
- 7720 S 166th St
- 7712 S 166th St
- 7722 S 167th St
- 7803 S 167th St
- 7709 S 167th St
- 7708 S 166th St
- 7718 S 167th St
- 7726 S 167th St
- 7802 S 166th St
- 7704 S 166th St
- 7710 S 167th St
- 7705 S 167th St
- 7807 S 167th St
- 7804 S 167th St
- 16548 Willow St
- 7806 S 166th St