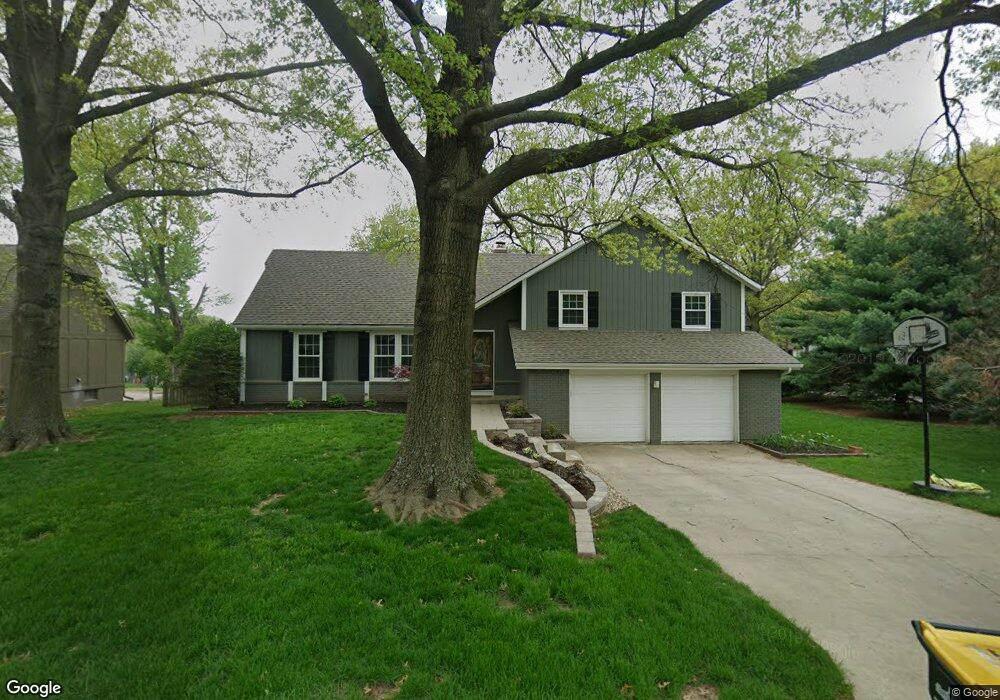
7726 Noland Rd Shawnee, KS 66216
Estimated Value: $419,000 - $436,000
5
Beds
3
Baths
2,023
Sq Ft
$212/Sq Ft
Est. Value
About This Home
This home is located at 7726 Noland Rd, Shawnee, KS 66216 and is currently estimated at $429,184, approximately $212 per square foot. 7726 Noland Rd is a home located in Johnson County with nearby schools including Mill Creek Elementary School, Trailridge Middle School, and Shawnee Mission Northwest High School.
Ownership History
Date
Name
Owned For
Owner Type
Purchase Details
Closed on
Aug 8, 2012
Sold by
Delaney Brian Patrick Howard and Delaney Kristina Marie
Bought by
Delaney Brian Patrick Howard and Delaney Kristina Marie
Current Estimated Value
Purchase Details
Closed on
Jul 28, 2009
Sold by
Hogenkamp Johnna and Bandle Johnna
Bought by
Delaney Brian and Delaney Kristina
Home Financials for this Owner
Home Financials are based on the most recent Mortgage that was taken out on this home.
Original Mortgage
$164,800
Outstanding Balance
$108,541
Interest Rate
5.41%
Mortgage Type
Purchase Money Mortgage
Estimated Equity
$320,643
Purchase Details
Closed on
Jan 31, 2009
Sold by
Bandle Johnna
Bought by
Hogenkamp Johnna
Purchase Details
Closed on
Sep 19, 2008
Sold by
Bandle Bruce and Bandle Johnna A
Bought by
Bandle Johnna
Home Financials for this Owner
Home Financials are based on the most recent Mortgage that was taken out on this home.
Original Mortgage
$186,300
Interest Rate
6.46%
Mortgage Type
FHA
Create a Home Valuation Report for This Property
The Home Valuation Report is an in-depth analysis detailing your home's value as well as a comparison with similar homes in the area
Home Values in the Area
Average Home Value in this Area
Purchase History
| Date | Buyer | Sale Price | Title Company |
|---|---|---|---|
| Delaney Brian Patrick Howard | -- | None Available | |
| Delaney Brian | -- | Continental Title Company | |
| Hogenkamp Johnna | -- | None Available | |
| Bandle Johnna | -- | American Title Group |
Source: Public Records
Mortgage History
| Date | Status | Borrower | Loan Amount |
|---|---|---|---|
| Open | Delaney Brian | $164,800 | |
| Previous Owner | Bandle Johnna | $186,300 |
Source: Public Records
Tax History Compared to Growth
Tax History
| Year | Tax Paid | Tax Assessment Tax Assessment Total Assessment is a certain percentage of the fair market value that is determined by local assessors to be the total taxable value of land and additions on the property. | Land | Improvement |
|---|---|---|---|---|
| 2024 | $4,538 | $41,067 | $8,254 | $32,813 |
| 2023 | $4,227 | $37,536 | $7,863 | $29,673 |
| 2022 | $4,354 | $38,640 | $7,148 | $31,492 |
| 2021 | $4,013 | $33,776 | $6,501 | $27,275 |
| 2020 | $3,937 | $32,810 | $6,501 | $26,309 |
| 2019 | $3,655 | $30,417 | $5,422 | $24,995 |
| 2018 | $3,737 | $30,843 | $5,422 | $25,421 |
| 2017 | $3,472 | $27,749 | $4,923 | $22,826 |
| 2016 | $3,394 | $26,784 | $4,727 | $22,057 |
| 2015 | $3,170 | $25,174 | $4,727 | $20,447 |
| 2013 | -- | $22,794 | $4,727 | $18,067 |
Source: Public Records
Map
Nearby Homes
- 8011 Gillette St
- 7904 Rosehill Rd
- 7736 Westgate Dr
- 7818 Westgate Dr
- 7514 Caenen Lake Rd
- 7917 Westgate Dr
- 7805 Long Ave
- 13004 W 74th Terrace
- 12212 W 79th Terrace
- 13716 W 75th Terrace
- 12808 W 82nd St
- 7526 Monrovia St
- 8215 Rosehill Rd
- 7502 Monrovia St
- 13800 W 75th Ct
- 7913 Colony Ln
- 12557 W 82nd Terrace
- 13212 W 84th St
- 13136 W 84th St
- 13100 W 72nd St
- 13111 W 77th Terrace
- 7730 Noland Rd
- 13015 W 77th Terrace
- 13102 W 77th Terrace
- 13117 W 77th Terrace
- 7800 Noland Rd
- 13108 W 77th Terrace
- 13205 W 77th Place
- 13016 W 78th St
- 13114 W 77th Terrace
- 13009 W 77th Terrace
- 7804 Noland Rd
- 13207 W 77th Place
- 7808 Noland Rd
- 13008 W 78th St
- 7803 Caenen Lake Rd
- 13006 W 77th Terrace
- 7719 Noland Rd
- 13201 W 77th Terrace
- 7708 Noland Rd