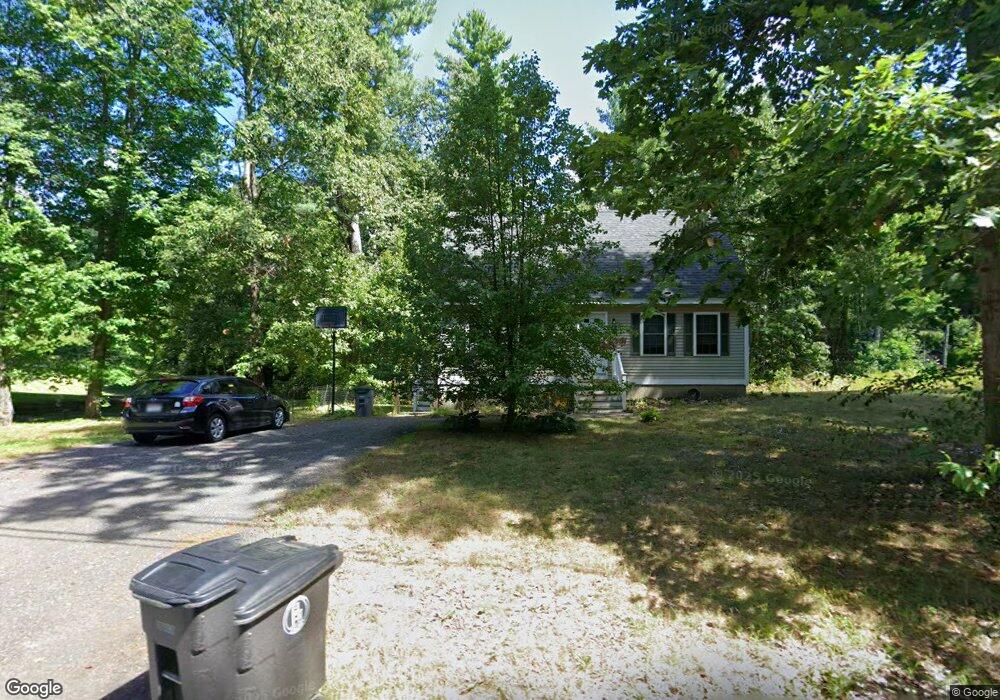
773 Clark St Gardner, MA 01440
Estimated Value: $381,000 - $461,000
3
Beds
2
Baths
1,147
Sq Ft
$367/Sq Ft
Est. Value
About This Home
This home is located at 773 Clark St, Gardner, MA 01440 and is currently estimated at $421,308, approximately $367 per square foot. 773 Clark St is a home with nearby schools including Gardner High School.
Ownership History
Date
Name
Owned For
Owner Type
Purchase Details
Closed on
Jun 12, 2020
Sold by
Broskowitz Allan C
Bought by
Broskowitz Allan C and Cowen Kaitlyn E
Current Estimated Value
Purchase Details
Closed on
Apr 1, 2015
Sold by
Broskowitz Allan C and Broskowitz Sarah J
Bought by
Broskowitz Allan C
Purchase Details
Closed on
Apr 14, 2011
Sold by
Fidelity Coop Bank
Bought by
Dymek Custom Builder I
Home Financials for this Owner
Home Financials are based on the most recent Mortgage that was taken out on this home.
Original Mortgage
$187,000
Interest Rate
4.89%
Mortgage Type
Purchase Money Mortgage
Purchase Details
Closed on
Nov 9, 2010
Sold by
New Englander Bldg Co
Bought by
Fidelity Coop Bk
Create a Home Valuation Report for This Property
The Home Valuation Report is an in-depth analysis detailing your home's value as well as a comparison with similar homes in the area
Home Values in the Area
Average Home Value in this Area
Purchase History
| Date | Buyer | Sale Price | Title Company |
|---|---|---|---|
| Broskowitz Allan C | -- | None Available | |
| Broskowitz Allan C | $2,000 | -- | |
| Dymek Custom Builder I | $80,000 | -- | |
| Fidelity Coop Bk | $156,330 | -- |
Source: Public Records
Mortgage History
| Date | Status | Borrower | Loan Amount |
|---|---|---|---|
| Previous Owner | Dymek Custom Builder I | $187,000 |
Source: Public Records
Tax History
| Year | Tax Paid | Tax Assessment Tax Assessment Total Assessment is a certain percentage of the fair market value that is determined by local assessors to be the total taxable value of land and additions on the property. | Land | Improvement |
|---|---|---|---|---|
| 2025 | $53 | $367,600 | $87,000 | $280,600 |
| 2024 | $5,267 | $351,400 | $79,200 | $272,200 |
| 2023 | $4,926 | $305,400 | $78,000 | $227,400 |
| 2022 | $4,722 | $254,000 | $58,800 | $195,200 |
| 2021 | $4,591 | $229,100 | $51,000 | $178,100 |
| 2020 | $4,522 | $229,100 | $51,000 | $178,100 |
| 2019 | $4,340 | $215,500 | $51,000 | $164,500 |
| 2018 | $4,125 | $203,500 | $51,000 | $152,500 |
| 2017 | $3,985 | $194,600 | $51,000 | $143,600 |
| 2016 | $3,797 | $185,500 | $51,000 | $134,500 |
| 2015 | $3,628 | $181,600 | $51,000 | $130,600 |
| 2014 | $3,544 | $187,800 | $56,400 | $131,400 |
Source: Public Records
Map
Nearby Homes
Your Personal Tour Guide
Ask me questions while you tour the home.