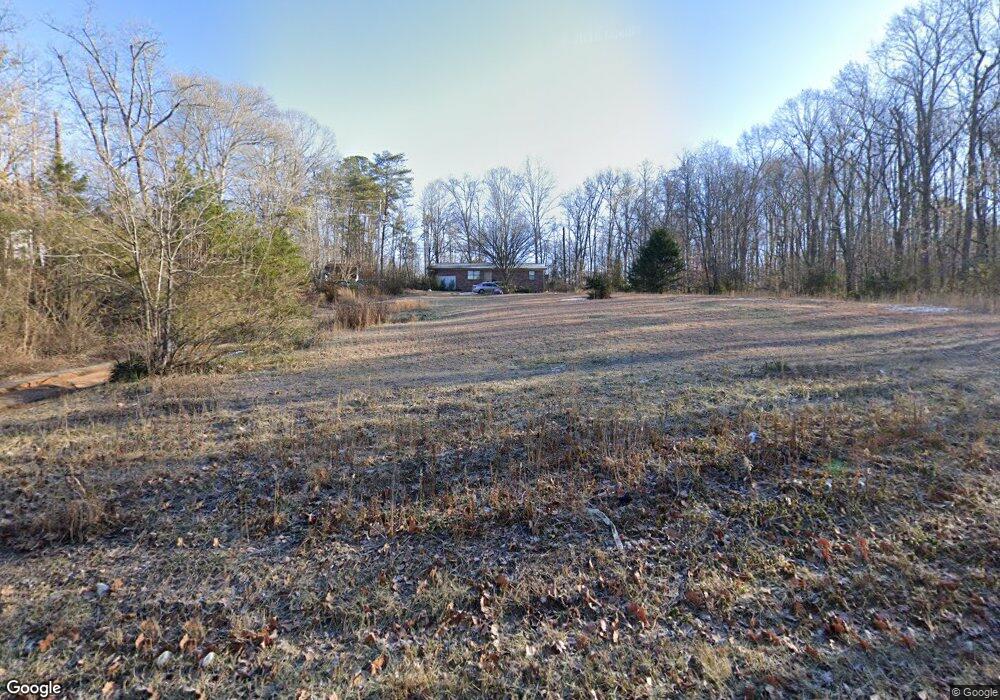
774 Old Dandridge Pike Strawberry Plains, TN 37871
Estimated Value: $161,113 - $224,000
--
Bed
1
Bath
1,248
Sq Ft
$155/Sq Ft
Est. Value
About This Home
This home is located at 774 Old Dandridge Pike, Strawberry Plains, TN 37871 and is currently estimated at $193,778, approximately $155 per square foot. 774 Old Dandridge Pike is a home located in Jefferson County with nearby schools including Blue Springs Christian Academy.
Ownership History
Date
Name
Owned For
Owner Type
Purchase Details
Closed on
Oct 2, 1997
Sold by
Edmonds David W and Edmonds Patricia
Bought by
Bennie Campbell
Current Estimated Value
Home Financials for this Owner
Home Financials are based on the most recent Mortgage that was taken out on this home.
Original Mortgage
$35,000
Interest Rate
7.55%
Purchase Details
Closed on
Oct 1, 1997
Bought by
Campbell Bennie and Campbell Phyllis
Home Financials for this Owner
Home Financials are based on the most recent Mortgage that was taken out on this home.
Original Mortgage
$35,000
Interest Rate
7.55%
Purchase Details
Closed on
May 17, 1990
Bought by
Edmonds David W and Edmonds Patricia
Purchase Details
Closed on
May 16, 1990
Bought by
Edmonds David W and Edmonds Patricia
Purchase Details
Closed on
Jun 30, 1988
Bought by
Ball Dennis L and Ball Rebecca A
Purchase Details
Closed on
Mar 29, 1985
Bought by
Roberts Billy William and Roberts Melissa B
Purchase Details
Closed on
Oct 13, 1980
Create a Home Valuation Report for This Property
The Home Valuation Report is an in-depth analysis detailing your home's value as well as a comparison with similar homes in the area
Home Values in the Area
Average Home Value in this Area
Purchase History
| Date | Buyer | Sale Price | Title Company |
|---|---|---|---|
| Bennie Campbell | $47,794 | -- | |
| Campbell Bennie | $47,800 | -- | |
| Edmonds David W | -- | -- | |
| Edmonds David W | $39,400 | -- | |
| Ball Dennis L | $35,100 | -- | |
| Roberts Billy William | -- | -- | |
| -- | -- | -- |
Source: Public Records
Mortgage History
| Date | Status | Borrower | Loan Amount |
|---|---|---|---|
| Closed | Not Available | $35,000 |
Source: Public Records
Tax History Compared to Growth
Tax History
| Year | Tax Paid | Tax Assessment Tax Assessment Total Assessment is a certain percentage of the fair market value that is determined by local assessors to be the total taxable value of land and additions on the property. | Land | Improvement |
|---|---|---|---|---|
| 2025 | $450 | $30,875 | $8,225 | $22,650 |
| 2023 | $450 | $19,575 | $0 | $0 |
| 2022 | $429 | $19,575 | $6,225 | $13,350 |
| 2021 | $429 | $19,575 | $6,225 | $13,350 |
| 2020 | $429 | $19,575 | $6,225 | $13,350 |
| 2019 | $429 | $19,575 | $6,225 | $13,350 |
| 2018 | $445 | $18,950 | $6,225 | $12,725 |
| 2017 | $445 | $18,950 | $6,225 | $12,725 |
| 2016 | $445 | $18,950 | $6,225 | $12,725 |
| 2015 | $445 | $18,950 | $6,225 | $12,725 |
| 2014 | $445 | $18,950 | $6,225 | $12,725 |
Source: Public Records
Map
Nearby Homes
- 2810 Daybreak Way
- 130 Westford Dr
- 2824 Vicksburg Ln
- 839 Bruner Rd
- 4853 Shady Rd
- 13 Laura Boling Loop Rd
- 21 Laura Boling Loop Rd
- 3598 Blue Springs Rd
- 4819 Hillard Ln
- Lot 9 Laura Boling Loop Rd
- 375 Old Dandridge Pike
- 22 Laura Boling Loop Rd
- 20 Laura Boling Loop Rd
- 10 Laura Boling Loop Rd
- 2 Laura Boling Loop Rd
- 0 Huffaker Dr
- 2 Stansberry Dr
- 4723 Chesney Meadows Dr
- 2415 Riddle Rd
- lots 13-16 Elm St
- 766 Old Dandridge Pike
- Parcel 067 Old Dandridge Pike
- 2820 Daybreak Way
- 2810 Daybreak Way Unit 14&P
- 2834 Daybreak Way
- 760 Old Dandridge Pike
- LOT 4 Daybreak Way
- 2836 Daybreak Way
- 0 Daybreak Way
- 4755 Old Dandridge Park
- 2825 Daybreak Way
- 2840 Daybreak Way
- 2835 Daybreak Way
- 807 Old Dandridge Pike
- 2837 Daybreak Way
- 2839 Daybreak Way
- 2841 Daybreak Way
- 1005 Briar Ridge Ln
- 1013 Briar Ridge Ln
- 1009 Briar Ridge Ln