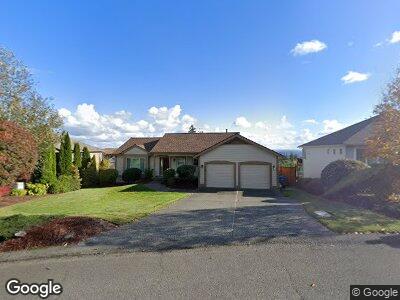
7744 Peridot Place NW Silverdale, WA 98383
Chico NeighborhoodEstimated Value: $584,355 - $703,000
3
Beds
3
Baths
1,276
Sq Ft
$505/Sq Ft
Est. Value
About This Home
This home is located at 7744 Peridot Place NW, Silverdale, WA 98383 and is currently estimated at $643,839, approximately $504 per square foot. 7744 Peridot Place NW is a home located in Kitsap County with nearby schools including Silverdale Elementary School, Central Kitsap Middle School, and Central Kitsap High School.
Ownership History
Date
Name
Owned For
Owner Type
Purchase Details
Closed on
Jul 6, 2020
Sold by
Flaherty Rita Anne and Dady Rita Ame
Bought by
Flaherty Rita Anne and Flaherty Michael John
Current Estimated Value
Home Financials for this Owner
Home Financials are based on the most recent Mortgage that was taken out on this home.
Original Mortgage
$130,000
Outstanding Balance
$118,312
Interest Rate
3.1%
Mortgage Type
New Conventional
Estimated Equity
$509,444
Purchase Details
Closed on
Sep 29, 2017
Sold by
Dady Rita Anne and Dady Joseph M
Bought by
Dady Rita Anne
Purchase Details
Closed on
Dec 5, 2003
Sold by
Galvani William P and Galvani Pamela L
Bought by
Dady Joseph Mark and Dady Rita Anne
Home Financials for this Owner
Home Financials are based on the most recent Mortgage that was taken out on this home.
Original Mortgage
$238,410
Interest Rate
5.92%
Mortgage Type
Purchase Money Mortgage
Create a Home Valuation Report for This Property
The Home Valuation Report is an in-depth analysis detailing your home's value as well as a comparison with similar homes in the area
Home Values in the Area
Average Home Value in this Area
Purchase History
| Date | Buyer | Sale Price | Title Company |
|---|---|---|---|
| Flaherty Rita Anne | -- | First American Title Ins Co | |
| Dady Rita Anne | -- | -- | |
| Dady Joseph Mark | $264,900 | Transnation Title Ins Co |
Source: Public Records
Mortgage History
| Date | Status | Borrower | Loan Amount |
|---|---|---|---|
| Open | Flaherty Rita Anne | $130,000 | |
| Closed | Dady Rita Anne | $262,500 | |
| Closed | Dady Joseph Mark | $45,000 | |
| Closed | Dady Joseph Mark | $238,410 |
Source: Public Records
Tax History Compared to Growth
Tax History
| Year | Tax Paid | Tax Assessment Tax Assessment Total Assessment is a certain percentage of the fair market value that is determined by local assessors to be the total taxable value of land and additions on the property. | Land | Improvement |
|---|---|---|---|---|
| 2025 | $5,207 | $554,770 | $134,590 | $420,180 |
| 2024 | $5,064 | $554,770 | $134,590 | $420,180 |
| 2023 | $4,651 | $506,250 | $149,510 | $356,740 |
| 2022 | $4,481 | $430,030 | $126,990 | $303,040 |
| 2021 | $4,315 | $394,290 | $116,180 | $278,110 |
| 2020 | $4,276 | $396,210 | $107,180 | $289,030 |
| 2019 | $4,086 | $366,690 | $99,070 | $267,620 |
| 2018 | $4,389 | $325,050 | $84,530 | $240,520 |
| 2017 | $4,140 | $325,050 | $84,530 | $240,520 |
| 2016 | $4,017 | $291,490 | $84,530 | $206,960 |
| 2015 | $3,847 | $291,490 | $84,530 | $206,960 |
| 2014 | -- | $274,710 | $84,530 | $190,180 |
| 2013 | -- | $274,710 | $84,530 | $190,180 |
Source: Public Records
Map
Nearby Homes
- 7819 Amethyst Loop NW
- 8082 Daniel Place NW
- 4495 Newberry Ln NW
- 4844 NW Walgren Dr
- 0 Dickey Unit NWM2317395
- 7911 Berry Ridge Rd NW
- 5746 Londonderry Loop NW
- 4817 NW Iris Ln
- 5069 NW Cedarside Loop
- 5029 NW Cedarside Loop
- 5077 NW Cedarside Loop
- 5041 NW Knute Anderson Rd
- 5021 NW Cedarside Loop
- 5045 NW Cedarside Loop
- 5061 NW Cedarside Loop
- 5085 NW Cedarside Loop
- 5013 NW Cedarside Loop
- 8121 Berry Ridge Ln NW
- 8701 Schoolway Place NW
- 8768 Schoolway Place NW
- 7744 Peridot Place NW
- 5107 NW Ebony Ct
- 7738 Peridot Place NW
- 7732 Peridot Place NW
- 7726 Peridot Place NW
- 7725 Peridot Place NW
- 7743 Peridot Place NW
- 7896 Amethyst Loop NW
- 7896 Amethyst Loop NW
- 7884 Amethyst Loop NW
- 5091 NW Ebony Ct
- 5099 NW Ebony Ct
- 7861 Amethyst Loop NW
- 5083 NW Ebony Ct
- 7737 Peridot Place NW
- 7867 Amethyst Loop NW
- 7731 Peridot Place NW
- 7902 Amethyst Loop NW
- 7878 Amethyst Loop NW
- 5084 NW Ebony Ct