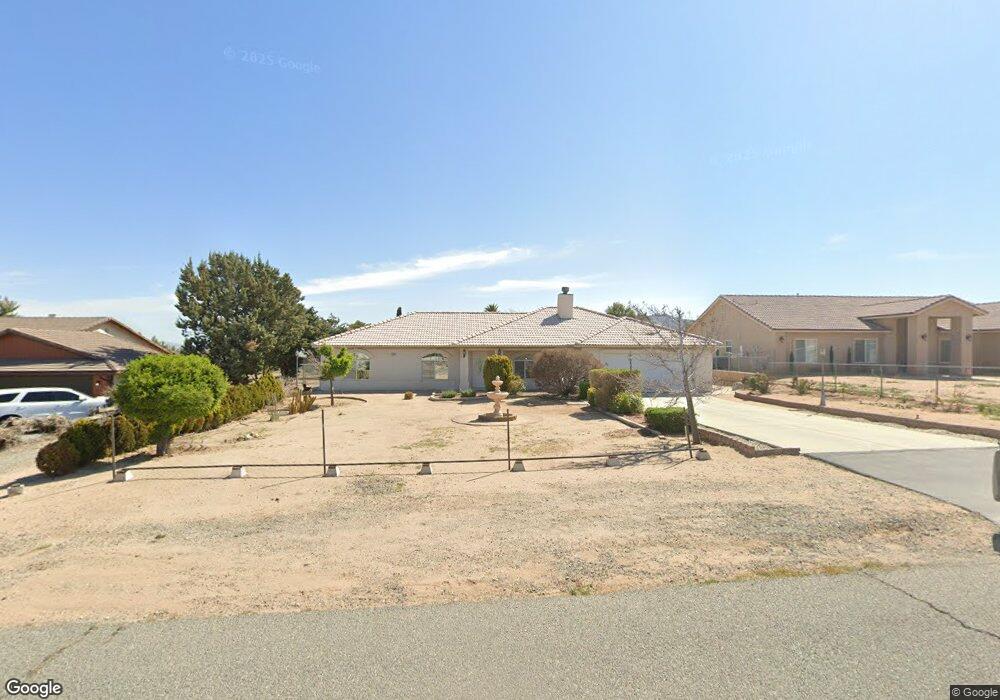
7749 Minstead Ave Hesperia, CA 92345
The Mesa NeighborhoodEstimated Value: $457,422 - $561,000
3
Beds
2
Baths
1,978
Sq Ft
$254/Sq Ft
Est. Value
About This Home
This home is located at 7749 Minstead Ave, Hesperia, CA 92345 and is currently estimated at $502,856, approximately $254 per square foot. 7749 Minstead Ave is a home located in San Bernardino County with nearby schools including Kingston Elementary School, Ranchero Middle School, and Sultana High School.
Ownership History
Date
Name
Owned For
Owner Type
Purchase Details
Closed on
Feb 2, 2025
Sold by
Gudmundson John Gayle and Freda Hays
Bought by
Freda Hays Gudmundson And John Gayle Gudmunds and Gudmundson
Current Estimated Value
Purchase Details
Closed on
Apr 10, 2002
Sold by
Tri M Builders Inc
Bought by
Gudmundson John Gayle and Gudmundson Freda Hays
Home Financials for this Owner
Home Financials are based on the most recent Mortgage that was taken out on this home.
Original Mortgage
$127,200
Interest Rate
6.78%
Purchase Details
Closed on
Sep 27, 2001
Sold by
Moran Home Builders Inc
Bought by
Tri M Builders Inc
Purchase Details
Closed on
Oct 11, 1996
Sold by
Stauter Russell H and Stauter Norma B
Bought by
Stauter Russell H and Stauter Norma B
Create a Home Valuation Report for This Property
The Home Valuation Report is an in-depth analysis detailing your home's value as well as a comparison with similar homes in the area
Home Values in the Area
Average Home Value in this Area
Purchase History
| Date | Buyer | Sale Price | Title Company |
|---|---|---|---|
| Freda Hays Gudmundson And John Gayle Gudmunds | -- | Accommodation/Courtesy Recordi | |
| Gudmundson John Gayle | $159,000 | Lawyers Title Company | |
| Tri M Builders Inc | -- | Lawyers Title Company | |
| Moran Home Builders Inc | $26,500 | Lawyers Title Company | |
| Stauter Russell H | -- | -- |
Source: Public Records
Mortgage History
| Date | Status | Borrower | Loan Amount |
|---|---|---|---|
| Previous Owner | Gudmundson John Gayle | $127,200 |
Source: Public Records
Tax History Compared to Growth
Tax History
| Year | Tax Paid | Tax Assessment Tax Assessment Total Assessment is a certain percentage of the fair market value that is determined by local assessors to be the total taxable value of land and additions on the property. | Land | Improvement |
|---|---|---|---|---|
| 2025 | $2,481 | $234,896 | $19,946 | $214,950 |
| 2024 | $2,481 | $230,290 | $19,555 | $210,735 |
| 2023 | $2,452 | $225,775 | $19,172 | $206,603 |
| 2022 | $2,395 | $221,348 | $18,796 | $202,552 |
| 2021 | $2,350 | $217,007 | $18,427 | $198,580 |
| 2020 | $2,322 | $214,782 | $18,238 | $196,544 |
| 2019 | $2,273 | $210,570 | $17,880 | $192,690 |
| 2018 | $2,228 | $206,441 | $17,529 | $188,912 |
| 2017 | $2,188 | $202,393 | $17,185 | $185,208 |
| 2016 | $2,140 | $198,424 | $16,848 | $181,576 |
| 2015 | $2,112 | $195,444 | $16,595 | $178,849 |
| 2014 | $1,985 | $180,600 | $35,700 | $144,900 |
Source: Public Records
Map
Nearby Homes
- 7697 Windsor Ave
- 7714 Paisley Ave
- 0 Paisley Ave
- 17995 Seaforth St
- 18010 Seaforth St
- 7762 Madera Ave
- 0 Oxford Ave Unit HD25072687
- 18110 Fairburn St
- 7681 Newhall Ave
- 0 Newhall Ave Unit HD25223892
- 7697 Montrose Ave
- 7331 I Ave
- 8167 Windsor Ave
- 8150 Minstead Ave
- Residence Four Plan at Silverwood - Journey
- Residence Three Plan at Silverwood - Journey
- Residence One Plan at Silverwood - Journey
- Residence Two Plan at Silverwood - Journey
- 7601 Corona Ave
- 7885 Montrose Ave
- 7735 Minstead Ave
- 7765 Minstead Ave
- 7764 Windsor Ave
- 7781 Minstead Ave
- 7719 Minstead Ave
- 7750 Windsor Ave
- 7780 Windsor Ave
- 7748 Minstead Ave
- 7766 Minstead Ave
- 7734 Minstead Ave
- 7734 Windsor Ave
- 7796 Windsor Ave
- 7795 Minstead Ave
- 7703 Minstead Ave
- 7780 Minstead Ave
- 7806 Windsor Ave
- 7794 Minstead Ave
- 7702 Minstead Ave
- 7801 Minstead Ave
- 7691 Minstead Ave