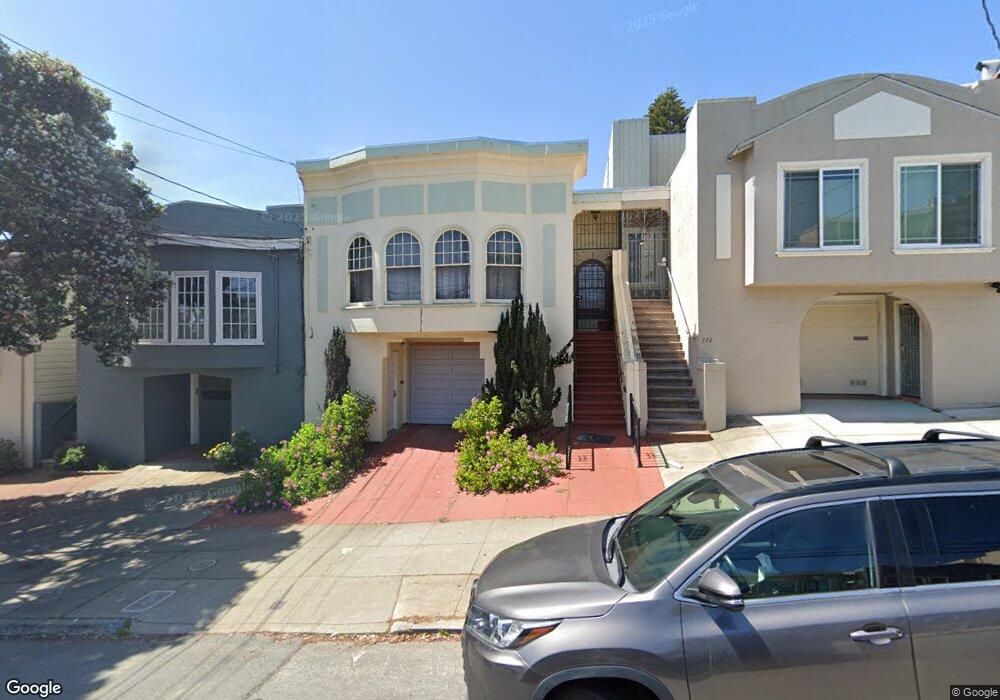
775 38th Ave San Francisco, CA 94121
Outer Richmond NeighborhoodEstimated Value: $1,187,000 - $1,713,000
2
Beds
1
Bath
1,359
Sq Ft
$1,129/Sq Ft
Est. Value
About This Home
This home is located at 775 38th Ave, San Francisco, CA 94121 and is currently estimated at $1,534,463, approximately $1,129 per square foot. 775 38th Ave is a home located in San Francisco County with nearby schools including Lafayette Elementary School, Presidio Middle School, and St. Thomas The Apostle School.
Ownership History
Date
Name
Owned For
Owner Type
Purchase Details
Closed on
Sep 28, 2011
Sold by
Farol Fernando and Farol Lorna
Bought by
Thai Van K and Thai Elga
Current Estimated Value
Purchase Details
Closed on
Mar 12, 2001
Sold by
Faro Stanley N and Grothe Howard L
Bought by
Faro Stanley N and Grothe Howard L
Home Financials for this Owner
Home Financials are based on the most recent Mortgage that was taken out on this home.
Original Mortgage
$351,950
Interest Rate
7.11%
Create a Home Valuation Report for This Property
The Home Valuation Report is an in-depth analysis detailing your home's value as well as a comparison with similar homes in the area
Home Values in the Area
Average Home Value in this Area
Purchase History
| Date | Buyer | Sale Price | Title Company |
|---|---|---|---|
| Thai Van K | $690,000 | Old Republic Title Company | |
| Faro Stanley N | -- | Fidelity National Title Co |
Source: Public Records
Mortgage History
| Date | Status | Borrower | Loan Amount |
|---|---|---|---|
| Previous Owner | Faro Stanley N | $351,950 | |
| Closed | Faro Stanley N | $528,700 |
Source: Public Records
Tax History Compared to Growth
Tax History
| Year | Tax Paid | Tax Assessment Tax Assessment Total Assessment is a certain percentage of the fair market value that is determined by local assessors to be the total taxable value of land and additions on the property. | Land | Improvement |
|---|---|---|---|---|
| 2025 | $10,743 | $866,666 | $606,668 | $259,998 |
| 2024 | $10,743 | $849,673 | $594,773 | $254,900 |
| 2023 | $10,576 | $833,013 | $583,111 | $249,902 |
| 2022 | $10,367 | $816,680 | $571,678 | $245,002 |
| 2021 | $10,181 | $800,668 | $560,469 | $240,199 |
| 2020 | $10,287 | $792,460 | $554,723 | $237,737 |
| 2019 | $9,889 | $776,923 | $543,847 | $233,076 |
| 2018 | $9,557 | $761,690 | $533,184 | $228,506 |
| 2017 | $9,146 | $746,756 | $522,730 | $224,026 |
| 2016 | $8,985 | $732,115 | $512,481 | $219,634 |
| 2015 | $8,873 | $721,119 | $504,784 | $216,335 |
| 2014 | $8,640 | $706,994 | $494,896 | $212,098 |
Source: Public Records
Map
Nearby Homes