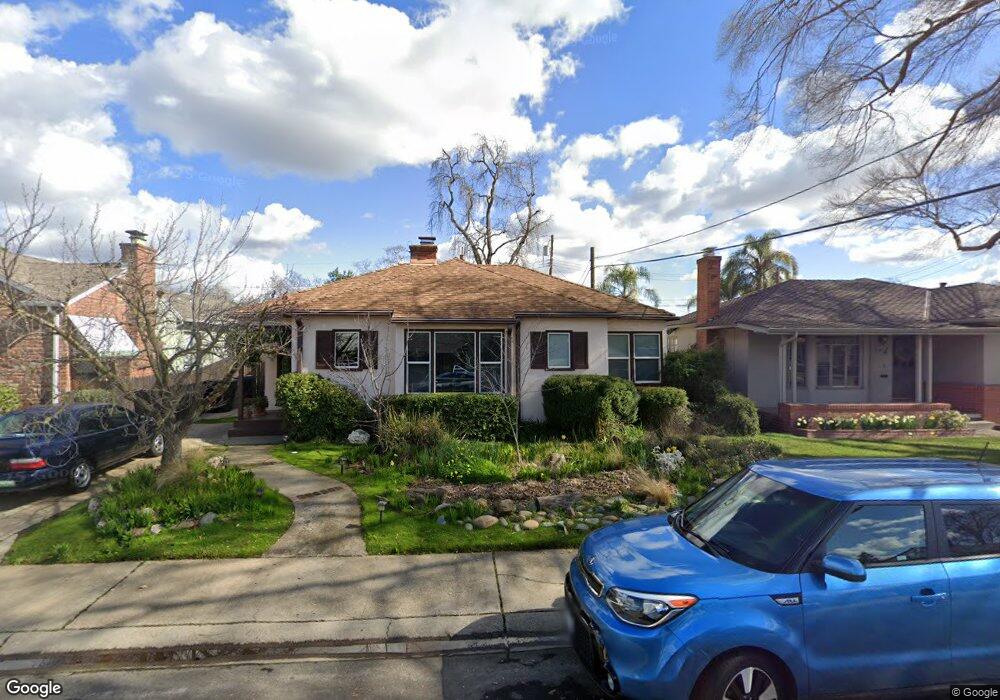
775 El Dorado Way Sacramento, CA 95819
East Sacramento NeighborhoodEstimated Value: $495,000 - $712,000
2
Beds
1
Bath
1,314
Sq Ft
$481/Sq Ft
Est. Value
About This Home
This home is located at 775 El Dorado Way, Sacramento, CA 95819 and is currently estimated at $632,654, approximately $481 per square foot. 775 El Dorado Way is a home located in Sacramento County with nearby schools including Caleb Greenwood Elementary, Miwok Middle School, and Hiram W. Johnson High School.
Ownership History
Date
Name
Owned For
Owner Type
Purchase Details
Closed on
Jan 15, 2009
Sold by
Tumminia Diane J and Tumminia Diana G
Bought by
Tumminia Diane J and The Diana Tumminia Trust
Current Estimated Value
Purchase Details
Closed on
Jun 3, 1996
Sold by
Hughes Kim and Hughes Kim A
Bought by
Nadeau Richard P and Tumminia Diana G
Home Financials for this Owner
Home Financials are based on the most recent Mortgage that was taken out on this home.
Original Mortgage
$145,350
Interest Rate
7.96%
Purchase Details
Closed on
Apr 26, 1994
Sold by
Hughes Kim A
Bought by
Stam David E and Hughes Kim A
Home Financials for this Owner
Home Financials are based on the most recent Mortgage that was taken out on this home.
Original Mortgage
$72,500
Interest Rate
7.79%
Create a Home Valuation Report for This Property
The Home Valuation Report is an in-depth analysis detailing your home's value as well as a comparison with similar homes in the area
Home Values in the Area
Average Home Value in this Area
Purchase History
| Date | Buyer | Sale Price | Title Company |
|---|---|---|---|
| Tumminia Diane J | -- | None Available | |
| Nadeau Richard P | $153,000 | First American Title | |
| Stam David E | -- | Chicago Title Company |
Source: Public Records
Mortgage History
| Date | Status | Borrower | Loan Amount |
|---|---|---|---|
| Closed | Nadeau Richard P | $145,350 | |
| Previous Owner | Stam David E | $72,500 |
Source: Public Records
Tax History Compared to Growth
Tax History
| Year | Tax Paid | Tax Assessment Tax Assessment Total Assessment is a certain percentage of the fair market value that is determined by local assessors to be the total taxable value of land and additions on the property. | Land | Improvement |
|---|---|---|---|---|
| 2025 | $2,998 | $254,142 | $99,659 | $154,483 |
| 2024 | $2,998 | $249,159 | $97,705 | $151,454 |
| 2023 | $2,926 | $244,275 | $95,790 | $148,485 |
| 2022 | $2,874 | $239,486 | $93,912 | $145,574 |
| 2021 | $2,738 | $234,791 | $92,071 | $142,720 |
| 2020 | $2,758 | $232,384 | $91,127 | $141,257 |
| 2019 | $2,698 | $227,829 | $89,341 | $138,488 |
| 2018 | $2,626 | $223,363 | $87,590 | $135,773 |
| 2017 | $2,588 | $218,984 | $85,873 | $133,111 |
| 2016 | $2,507 | $214,691 | $84,190 | $130,501 |
| 2015 | $2,469 | $211,467 | $82,926 | $128,541 |
| 2014 | $2,401 | $207,326 | $81,302 | $126,024 |
Source: Public Records
Map
Nearby Homes