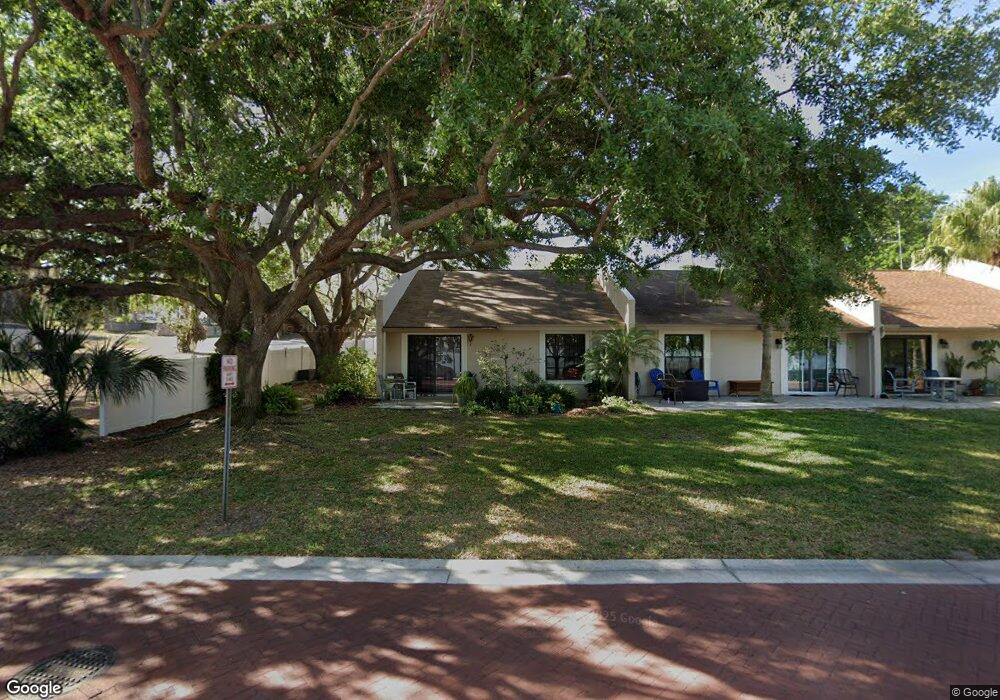
775 W Osceola St Unit 4 Clermont, FL 34711
Indian Hills NeighborhoodEstimated Value: $264,872 - $278,000
2
Beds
2
Baths
1,080
Sq Ft
$251/Sq Ft
Est. Value
About This Home
This home is located at 775 W Osceola St Unit 4, Clermont, FL 34711 and is currently estimated at $271,468, approximately $251 per square foot. 775 W Osceola St Unit 4 is a home located in Lake County with nearby schools including Aurelia Cole Academy, South Lake High School, and Wesley Christian Academy.
Ownership History
Date
Name
Owned For
Owner Type
Purchase Details
Closed on
Jul 3, 2024
Sold by
Apodaca Edward Andrew
Bought by
Finkelstein Judy M
Current Estimated Value
Home Financials for this Owner
Home Financials are based on the most recent Mortgage that was taken out on this home.
Original Mortgage
$200,000
Outstanding Balance
$197,588
Interest Rate
6.94%
Mortgage Type
New Conventional
Estimated Equity
$73,880
Purchase Details
Closed on
Sep 15, 2016
Sold by
Apodaca Edward A and Apodaca Linda M
Bought by
Apodaca Edward Alphonso and Apodaca Linda Marie
Purchase Details
Closed on
Sep 28, 2007
Sold by
Williams James M
Bought by
Apodaca Edward and Apodaca Linda
Home Financials for this Owner
Home Financials are based on the most recent Mortgage that was taken out on this home.
Original Mortgage
$110,000
Interest Rate
6.57%
Mortgage Type
Purchase Money Mortgage
Create a Home Valuation Report for This Property
The Home Valuation Report is an in-depth analysis detailing your home's value as well as a comparison with similar homes in the area
Home Values in the Area
Average Home Value in this Area
Purchase History
| Date | Buyer | Sale Price | Title Company |
|---|---|---|---|
| Finkelstein Judy M | $250,000 | Integrity First Title | |
| Apodaca Edward Alphonso | -- | Attorney | |
| Apodaca Edward | $163,000 | Metes & Bounds Title Company |
Source: Public Records
Mortgage History
| Date | Status | Borrower | Loan Amount |
|---|---|---|---|
| Open | Finkelstein Judy M | $200,000 | |
| Previous Owner | Apodaca Edward | $110,000 |
Source: Public Records
Tax History Compared to Growth
Tax History
| Year | Tax Paid | Tax Assessment Tax Assessment Total Assessment is a certain percentage of the fair market value that is determined by local assessors to be the total taxable value of land and additions on the property. | Land | Improvement |
|---|---|---|---|---|
| 2025 | $2,921 | $234,713 | $60,175 | $174,538 |
| 2024 | $2,921 | $234,713 | $60,175 | $174,538 |
| 2023 | $2,921 | $229,246 | $60,175 | $169,071 |
| 2022 | $2,729 | $218,196 | $49,125 | $169,071 |
| 2021 | $2,218 | $161,563 | $0 | $0 |
| 2020 | $1,747 | $104,129 | $0 | $0 |
| 2019 | $1,732 | $104,129 | $0 | $0 |
| 2018 | $1,491 | $85,836 | $0 | $0 |
| 2017 | $1,350 | $76,014 | $0 | $0 |
| 2016 | $1,375 | $76,014 | $0 | $0 |
| 2015 | $1,395 | $74,775 | $0 | $0 |
| 2014 | $1,349 | $73,648 | $0 | $0 |
Source: Public Records
Map
Nearby Homes
- 561 W Minneola Ave
- 770 W Broome St
- 883 10th St
- 999 W Juniata St
- 0 W Highway 50
- 0 5th St
- 901 12th St
- 1210 7th St
- 969 Chestnut St
- 1217 10th St
- 225 W Osceola St
- 1385 Lake Ave
- 955 Seminole St
- 1249 12th St
- 2411 Palm St
- 135 Carroll St
- 1120 W Magnolia St
- 0 East Ave Unit MFRG5095417
- 1130 W Minnehaha Ave
- 1620 5th St
- 777 W Osceola St
- 779 W Osceola St Unit 2
- 781 W Osceola St
- 783 W Osceola St
- 785 W Osceola St
- 741 W Osceola St
- 790 W Minneola Ave
- 524 8th St
- 528 8th St
- 848 W Osceola St
- 857 W Osceola St
- 627 8th St
- 505 7th St
- 696 W Minneola Ave
- 821 W Minneola Ave
- 705 W Minneola Ave
- 751 W Minneola Ave
- 875 W Osceola St Unit A
- 875 W Osceola St Unit A/B
- 875 W Osceola St