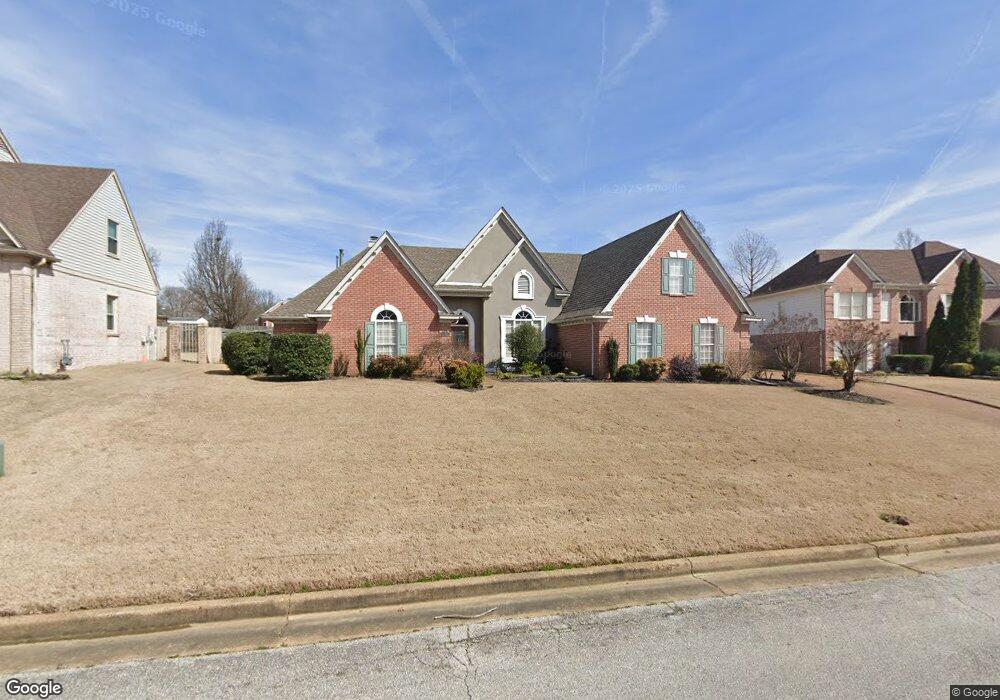
7750 October Rose Dr Memphis, TN 38119
Southern Shelby County NeighborhoodEstimated Value: $336,000 - $360,000
4
Beds
3
Baths
3,160
Sq Ft
$111/Sq Ft
Est. Value
About This Home
This home is located at 7750 October Rose Dr, Memphis, TN 38119 and is currently estimated at $350,191, approximately $110 per square foot. 7750 October Rose Dr is a home located in Shelby County with nearby schools including Oak Forest Elementary, Ridgeway Middle School, and Ridgeway High School.
Ownership History
Date
Name
Owned For
Owner Type
Purchase Details
Closed on
Mar 2, 2006
Sold by
Emc Mortgage Corp
Bought by
Massey Ethel Jean
Current Estimated Value
Home Financials for this Owner
Home Financials are based on the most recent Mortgage that was taken out on this home.
Original Mortgage
$164,800
Interest Rate
6.28%
Mortgage Type
Fannie Mae Freddie Mac
Purchase Details
Closed on
Apr 26, 1999
Sold by
Dryer William P and Dryer Susan W
Bought by
Brewer Antonio R and Brewer Robin R
Home Financials for this Owner
Home Financials are based on the most recent Mortgage that was taken out on this home.
Original Mortgage
$193,500
Interest Rate
10.25%
Purchase Details
Closed on
Oct 15, 1996
Sold by
R & R Partners Llc
Bought by
Dryer William P and Dryer Susan W
Home Financials for this Owner
Home Financials are based on the most recent Mortgage that was taken out on this home.
Original Mortgage
$126,790
Interest Rate
8.28%
Mortgage Type
FHA
Create a Home Valuation Report for This Property
The Home Valuation Report is an in-depth analysis detailing your home's value as well as a comparison with similar homes in the area
Home Values in the Area
Average Home Value in this Area
Purchase History
| Date | Buyer | Sale Price | Title Company |
|---|---|---|---|
| Massey Ethel Jean | $206,000 | Associates Closing & Title H | |
| Brewer Antonio R | $215,000 | Southern Escrow Title Compan | |
| Dryer William P | $155,000 | Southern Escrow Title Compan |
Source: Public Records
Mortgage History
| Date | Status | Borrower | Loan Amount |
|---|---|---|---|
| Previous Owner | Massey Ethel Jean | $164,800 | |
| Previous Owner | Brewer Antonio R | $193,500 | |
| Previous Owner | Dryer William P | $126,790 | |
| Closed | Brewer Antonio R | $10,750 |
Source: Public Records
Tax History Compared to Growth
Tax History
| Year | Tax Paid | Tax Assessment Tax Assessment Total Assessment is a certain percentage of the fair market value that is determined by local assessors to be the total taxable value of land and additions on the property. | Land | Improvement |
|---|---|---|---|---|
| 2025 | $2,259 | $82,925 | $11,500 | $71,425 |
| 2024 | $2,259 | $66,625 | $11,175 | $55,450 |
| 2023 | $4,059 | $66,625 | $11,175 | $55,450 |
| 2022 | $4,059 | $66,625 | $11,175 | $55,450 |
| 2021 | $4,106 | $66,625 | $11,175 | $55,450 |
| 2020 | $3,663 | $50,550 | $9,300 | $41,250 |
| 2019 | $3,663 | $50,550 | $9,300 | $41,250 |
| 2018 | $3,663 | $50,550 | $9,300 | $41,250 |
| 2017 | $2,078 | $50,550 | $9,300 | $41,250 |
| 2016 | $2,021 | $46,250 | $0 | $0 |
| 2014 | $2,021 | $46,250 | $0 | $0 |
Source: Public Records
Map
Nearby Homes
- 7753 October Rose Dr
- 7637 Cross Village Dr
- 2899 Cross Country Dr
- 3046 Dee Ann Dr
- 3076 Dee Ann Dr
- 7582 Callis Creek Dr
- 3155 Copiah Cove
- 7846 Players Club Pkwy
- 2926 Elm Ridge Cove
- 7448 Meadow Rise Cove
- 0 Hacks Cross Rd
- 8091 Ridgetown Ln
- 7726 Stout Rd
- 2611 Moore Rd
- 7876 Winoak Ln
- 3507 Hacks Cove
- 2639 Cedar Ridge Dr
- 7594 Stout Rd
- 2921 Crye Crest Cove
- 7583 Tagg Dr
- 7754 October Rose Dr
- 7746 October Rose Dr
- 3029 Holly Heath Dr
- 3035 Holly Heath Dr
- 7749 October Rose Dr
- 7758 October Rose Dr
- 3047 Holly Heath Dr
- 7740 October Rose Dr
- 3019 Holly Heath Dr
- 7733 October Rose Dr
- 7757 October Rose Dr
- 3057 Holly Heath Dr
- 3057 Holly Heath Dr
- 7734 October Rose Dr
- 7726 Candy Apple Cove
- 7762 October Rose Dr
- 3007 Holly Heath Dr
- 3020 Holly Heath Dr
- 7721 October Rose Dr
- 7722 Candy Apple Cove