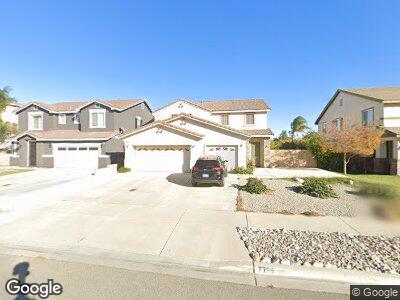
7759 Freesia Way Fontana, CA 92336
Estimated Value: $728,000 - $938,000
4
Beds
3
Baths
2,782
Sq Ft
$285/Sq Ft
Est. Value
About This Home
This home is located at 7759 Freesia Way, Fontana, CA 92336 and is currently estimated at $792,696, approximately $284 per square foot. 7759 Freesia Way is a home located in San Bernardino County with nearby schools including Virginia Primrose Elementary School, Alder Middle School, and Fontana A. B. Miller High School.
Ownership History
Date
Name
Owned For
Owner Type
Purchase Details
Closed on
Oct 12, 2011
Sold by
Fannie Mae
Bought by
Ibe Lavender
Current Estimated Value
Home Financials for this Owner
Home Financials are based on the most recent Mortgage that was taken out on this home.
Original Mortgage
$212,000
Interest Rate
4.01%
Mortgage Type
New Conventional
Purchase Details
Closed on
Jun 28, 2011
Sold by
Cordova Gomez Abraham and Cordova Gomez Blanca
Bought by
Federal National Mortgage Association
Purchase Details
Closed on
May 16, 2007
Sold by
G2 Homes Llc
Bought by
Cordova Gomez Abraham and Cordova Gomez Blanca
Home Financials for this Owner
Home Financials are based on the most recent Mortgage that was taken out on this home.
Original Mortgage
$375,300
Interest Rate
6.22%
Mortgage Type
Purchase Money Mortgage
Create a Home Valuation Report for This Property
The Home Valuation Report is an in-depth analysis detailing your home's value as well as a comparison with similar homes in the area
Home Values in the Area
Average Home Value in this Area
Purchase History
| Date | Buyer | Sale Price | Title Company |
|---|---|---|---|
| Ibe Lavender | $265,000 | Old Republic Title Company | |
| Federal National Mortgage Association | $214,400 | None Available | |
| Cordova Gomez Abraham | $417,000 | Stewart Title Of Ca Inc |
Source: Public Records
Mortgage History
| Date | Status | Borrower | Loan Amount |
|---|---|---|---|
| Open | Ibe Lavender | $233,000 | |
| Closed | Ibe Lavender | $212,000 | |
| Previous Owner | Cordova Gomez Abraham | $375,300 |
Source: Public Records
Tax History Compared to Growth
Tax History
| Year | Tax Paid | Tax Assessment Tax Assessment Total Assessment is a certain percentage of the fair market value that is determined by local assessors to be the total taxable value of land and additions on the property. | Land | Improvement |
|---|---|---|---|---|
| 2024 | $6,086 | $326,328 | $73,885 | $252,443 |
| 2023 | $5,516 | $319,929 | $72,436 | $247,493 |
| 2022 | $5,483 | $313,656 | $71,016 | $242,640 |
| 2021 | $5,433 | $307,506 | $69,624 | $237,882 |
| 2020 | $5,410 | $304,353 | $68,910 | $235,443 |
| 2019 | $5,310 | $298,385 | $67,559 | $230,826 |
| 2018 | $5,338 | $292,534 | $66,234 | $226,300 |
| 2017 | $5,293 | $286,798 | $64,935 | $221,863 |
| 2016 | $5,213 | $281,175 | $63,662 | $217,513 |
| 2015 | $5,231 | $276,952 | $62,706 | $214,246 |
| 2014 | $5,220 | $271,527 | $61,478 | $210,049 |
Source: Public Records
Map
Nearby Homes
- 18113 Raymond Ct
- 930 N Forest Ave
- 18233 Montgomery Ave
- 1076 N Ironwood Ave
- 1636 W Jackson St
- 18045 Foothill Blvd
- 17848 17858 Foothill Blvd
- 658 N Quince Ave
- 1256 W Morgan St
- 250 N Linden Ave Unit 57
- 250 N Linden Ave Unit 312
- 250 N Linden Ave Unit 2
- 250 N Linden Ave Unit 129
- 250 N Linden Ave Unit 141
- 17651 Fairfax St
- 8019 Alder Ave
- 1204 W Victoria St
- 862 N Martin St
- 17603 Fairfax St
- 7740 Lombardy Ave
- 7759 Freesia Way
- 7749 Freesia Way
- 7769 Freesia Way
- 7741 Freesia Way
- 7777 Freesia Way
- 7787 Freesia Way
- 7760 Freesia Way
- 7770 Freesia Way
- 7740 Freesia Way Unit 14
- 7740 Freesia Way
- 7780 Freesia Way
- 7723 Freesia Way
- 7795 Freesia Way Unit 10
- 7795 Freesia Way
- 7732 Freesia Way
- 7784 Maple Ave
- 7713 Freesia Way
- 7792 Freesia Way
- 18185 Celsia Place
- 7722 Freesia Way