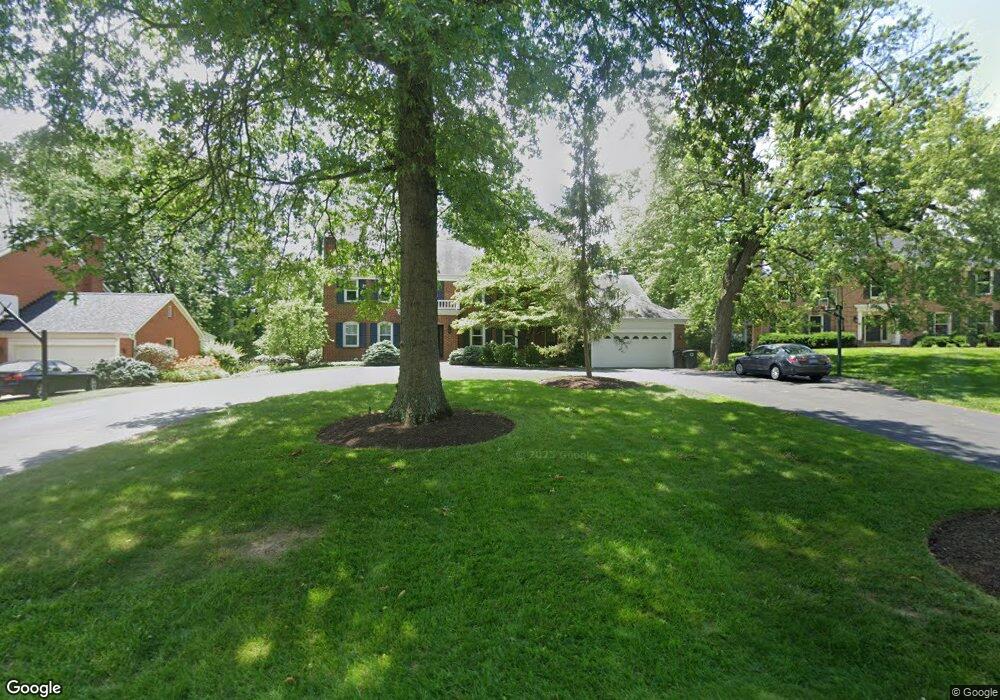
7765 Ivygate Ln Montgomery, OH 45242
Estimated Value: $1,014,538 - $1,199,000
4
Beds
5
Baths
4,335
Sq Ft
$254/Sq Ft
Est. Value
About This Home
This home is located at 7765 Ivygate Ln, Montgomery, OH 45242 and is currently estimated at $1,101,385, approximately $254 per square foot. 7765 Ivygate Ln is a home located in Hamilton County with nearby schools including Edwin H Greene Intermediate Middle School, Sycamore Junior High School, and Sycamore High School.
Ownership History
Date
Name
Owned For
Owner Type
Purchase Details
Closed on
Jun 25, 2008
Sold by
Jacobs Kenneth E and Jacobs Kelly K
Bought by
Nesbitt Howard Scott
Current Estimated Value
Home Financials for this Owner
Home Financials are based on the most recent Mortgage that was taken out on this home.
Original Mortgage
$417,000
Outstanding Balance
$267,514
Interest Rate
5.96%
Mortgage Type
Purchase Money Mortgage
Estimated Equity
$833,871
Purchase Details
Closed on
May 1, 2001
Sold by
Johnson Sharon P and Johnson William B
Bought by
Jacobs Kenneth E and Jacobs Kelly K
Home Financials for this Owner
Home Financials are based on the most recent Mortgage that was taken out on this home.
Original Mortgage
$328,000
Interest Rate
7.18%
Purchase Details
Closed on
Mar 18, 1996
Sold by
Johnson William B and Johnson Sharon P
Bought by
Johnson Sharon P
Create a Home Valuation Report for This Property
The Home Valuation Report is an in-depth analysis detailing your home's value as well as a comparison with similar homes in the area
Home Values in the Area
Average Home Value in this Area
Purchase History
| Date | Buyer | Sale Price | Title Company |
|---|---|---|---|
| Nesbitt Howard Scott | -- | Attorney | |
| Jacobs Kenneth E | $470,000 | Classic Title Agency Inc | |
| Johnson Sharon P | -- | -- |
Source: Public Records
Mortgage History
| Date | Status | Borrower | Loan Amount |
|---|---|---|---|
| Open | Nesbitt Howard Scott | $417,000 | |
| Previous Owner | Jacobs Kenneth E | $328,000 |
Source: Public Records
Tax History Compared to Growth
Tax History
| Year | Tax Paid | Tax Assessment Tax Assessment Total Assessment is a certain percentage of the fair market value that is determined by local assessors to be the total taxable value of land and additions on the property. | Land | Improvement |
|---|---|---|---|---|
| 2024 | $13,384 | $267,821 | $47,807 | $220,014 |
| 2023 | $13,459 | $267,821 | $47,807 | $220,014 |
| 2022 | $12,118 | $201,125 | $43,824 | $157,301 |
| 2021 | $11,882 | $201,125 | $43,824 | $157,301 |
| 2020 | $11,984 | $201,125 | $43,824 | $157,301 |
| 2019 | $11,824 | $182,841 | $39,841 | $143,000 |
| 2018 | $11,399 | $182,841 | $39,841 | $143,000 |
| 2017 | $9,699 | $182,841 | $39,841 | $143,000 |
| 2016 | $10,787 | $196,200 | $40,775 | $155,425 |
| 2015 | $9,626 | $196,200 | $40,775 | $155,425 |
| 2014 | $9,659 | $196,200 | $40,775 | $155,425 |
| 2013 | $9,304 | $183,365 | $38,108 | $145,257 |
Source: Public Records
Map
Nearby Homes
- 10120 Woodfern Way
- 7835 Pfeiffer Rd
- 7840 Pfeiffer Rd
- 10451 Grand Oaks Ln
- 10450 Grandoaks Ln
- 7961 Elbrecht Dr
- 10029 Windzag Ln
- 10019 Zig Zag Rd
- 10489 Cinderella Dr
- 15 Old Orchard Ln
- 101 Shakerdale Rd
- 5700 Samstone Ct
- 10128 Zig Zag Rd
- 10555 Montgomery Rd
- 10555 Montgomery Rd Unit 89
- 10555 Montgomery Rd Unit 69
- 7775 Ivygate Ln
- 7755 Ivygate Ln
- 7785 Ivygate Ln
- 7745 Ivygate Ln
- 7770 Ivygate Ln
- 7760 Ivygate Ln
- 10204 Glenash Ct
- 7780 Ivygate Ln
- 7795 Ivygate Ln
- 7750 Ivygate Ln
- 10206 Glenash Ct
- 9840 Forestglen Dr
- 10122 Woodfern Way
- 9838 Forestglen Dr
- 7790 Ivygate Ln
- 7805 Ivygate Ln
- 10205 Glenash Ct
- 10124 Woodfern Way
- 10295 Southwind Dr
- .825 AC Humphrey Rd