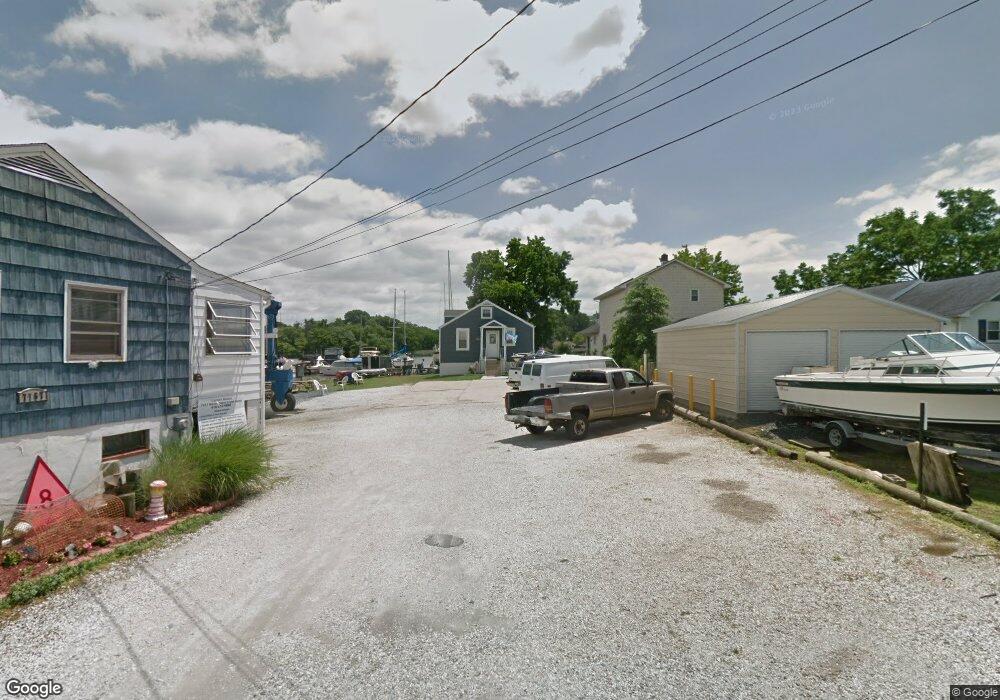
7767 N Point Creek Rd Sparrows Point, MD 21219
Estimated Value: $975,000 - $995,623
--
Bed
2
Baths
1,548
Sq Ft
$637/Sq Ft
Est. Value
About This Home
This home is located at 7767 N Point Creek Rd, Sparrows Point, MD 21219 and is currently estimated at $985,312, approximately $636 per square foot. 7767 N Point Creek Rd is a home located in Baltimore County with nearby schools including Chesapeake Terrace Elementary School, Sparrows Point Middle School, and Sparrows Point High School.
Ownership History
Date
Name
Owned For
Owner Type
Purchase Details
Closed on
Aug 8, 2008
Sold by
Skarda Robin
Bought by
Laynes Marine Inc
Current Estimated Value
Purchase Details
Closed on
Aug 4, 2008
Sold by
Skarda Robin
Bought by
Laynes Marine Inc
Purchase Details
Closed on
May 22, 2006
Sold by
Skarda Robin
Bought by
Skarda Robin and Skarda James
Purchase Details
Closed on
May 15, 2006
Sold by
Skarda Robin
Bought by
Skarda Robin and Skarda James
Purchase Details
Closed on
Sep 20, 2005
Sold by
Love Robert W
Bought by
Skarda Robin
Home Financials for this Owner
Home Financials are based on the most recent Mortgage that was taken out on this home.
Original Mortgage
$135,000
Interest Rate
5.81%
Mortgage Type
New Conventional
Create a Home Valuation Report for This Property
The Home Valuation Report is an in-depth analysis detailing your home's value as well as a comparison with similar homes in the area
Home Values in the Area
Average Home Value in this Area
Purchase History
| Date | Buyer | Sale Price | Title Company |
|---|---|---|---|
| Laynes Marine Inc | $400,000 | -- | |
| Laynes Marine Inc | $400,000 | -- | |
| Skarda Robin | -- | -- | |
| Skarda Robin | -- | -- | |
| Skarda Robin | -- | -- | |
| Skarda Robin | -- | -- |
Source: Public Records
Mortgage History
| Date | Status | Borrower | Loan Amount |
|---|---|---|---|
| Previous Owner | Skarda Robin | $135,000 |
Source: Public Records
Tax History Compared to Growth
Tax History
| Year | Tax Paid | Tax Assessment Tax Assessment Total Assessment is a certain percentage of the fair market value that is determined by local assessors to be the total taxable value of land and additions on the property. | Land | Improvement |
|---|---|---|---|---|
| 2025 | $8,085 | $668,367 | -- | -- |
| 2024 | $8,085 | $486,933 | $0 | $0 |
| 2023 | $2,989 | $305,500 | $161,400 | $144,100 |
| 2022 | $5,386 | $305,500 | $161,400 | $144,100 |
| 2021 | $2,890 | $305,500 | $161,400 | $144,100 |
| 2020 | $5,559 | $323,400 | $161,400 | $162,000 |
| 2019 | $3,920 | $323,400 | $161,400 | $162,000 |
| 2018 | $6,391 | $323,400 | $161,400 | $162,000 |
| 2017 | $5,520 | $359,800 | $0 | $0 |
| 2016 | $5,931 | $359,800 | $0 | $0 |
| 2015 | $5,931 | $359,900 | $0 | $0 |
| 2014 | $5,931 | $362,300 | $0 | $0 |
Source: Public Records
Map
Nearby Homes
- 7708 S Cove Rd
- 2409 Woodridge Rd
- 2322 Lodge Forest Dr
- 8610 Oak Rd
- 2122 Lodge Forest Dr
- 2217 Lodge Farm Rd
- 2408 Lodge Farm Rd
- 0 Lodge Farm Rd
- 7428 Bay Front Rd
- 2400 Lincoln Ave Unit 2
- 2400 Lincoln Ave Unit 15
- 7349 Hughes Ave
- 2924 Waterfront Way
- 2918 Waterfront Way
- 2636 Haddaway Rd
- 7316A Hughes Ave
- 2703 Sparrows Point Rd
- 2542 Sycamore Ave
- 2904 Shaws Rd
- 2621 N Snyder Ave
- 7763 North Point Creek Rd
- 7763 N Point Creek Rd
- 7744 S Cove Rd
- 7761 North Point Creek Rd
- 7761 N Point Creek Rd
- 7742 S Cove Rd
- 7759 N Point Creek Rd
- 7759 North Point Creek Rd
- 7740 S Cove Rd
- 7757 North Point Creek Rd
- 7738 S Cove Rd
- 7755 North Point Creek Rd
- 7736 S Cove Rd
- 7753 N Point Creek Rd
- 7753 North Point Creek Rd
- 7751 N Point Creek Rd
- 7734 S Cove Rd
- 7751 North Point Creek Rd
- 7732 S Cove Rd
- 7719 S Cove Rd