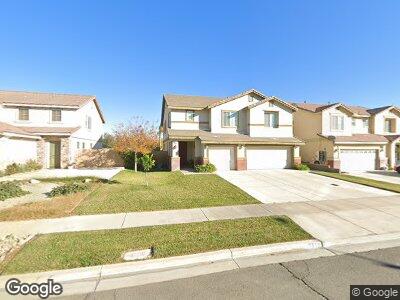
7769 Freesia Way Fontana, CA 92336
Estimated Value: $698,000 - $774,000
5
Beds
3
Baths
3,215
Sq Ft
$234/Sq Ft
Est. Value
About This Home
This home is located at 7769 Freesia Way, Fontana, CA 92336 and is currently estimated at $753,213, approximately $234 per square foot. 7769 Freesia Way is a home located in San Bernardino County with nearby schools including Virginia Primrose Elementary School, Alder Middle School, and Fontana A. B. Miller High School.
Ownership History
Date
Name
Owned For
Owner Type
Purchase Details
Closed on
Oct 26, 2011
Sold by
Community Rebuild Asset Holdings I Llc
Bought by
Chen William Y
Current Estimated Value
Purchase Details
Closed on
Aug 30, 2011
Sold by
Community Rebuild Asset Holdings Llc
Bought by
Community Rebuild Asset Holdings I Llc
Purchase Details
Closed on
Jul 19, 2011
Sold by
Jpmorgan Chase Bank National Association
Bought by
Community Rebuild Asset Holdings Llc
Purchase Details
Closed on
Mar 21, 2011
Sold by
Armstrong Renee
Bought by
Chase Home Finance Llc
Purchase Details
Closed on
May 16, 2007
Sold by
G2 Homes Llc
Bought by
Armstrong Renee
Home Financials for this Owner
Home Financials are based on the most recent Mortgage that was taken out on this home.
Original Mortgage
$552,550
Interest Rate
6.67%
Mortgage Type
Purchase Money Mortgage
Create a Home Valuation Report for This Property
The Home Valuation Report is an in-depth analysis detailing your home's value as well as a comparison with similar homes in the area
Home Values in the Area
Average Home Value in this Area
Purchase History
| Date | Buyer | Sale Price | Title Company |
|---|---|---|---|
| Chen William Y | $320,000 | Chicago Title Company | |
| Community Rebuild Asset Holdings I Llc | -- | Chicago Title Company | |
| Community Rebuild Asset Holdings Llc | $285,000 | Chicago Title Company | |
| Chase Home Finance Llc | $261,000 | Accommodation | |
| Armstrong Renee | $553,000 | Stewart Title Of Ca Inc |
Source: Public Records
Mortgage History
| Date | Status | Borrower | Loan Amount |
|---|---|---|---|
| Previous Owner | Armstrong Renee | $552,550 |
Source: Public Records
Tax History Compared to Growth
Tax History
| Year | Tax Paid | Tax Assessment Tax Assessment Total Assessment is a certain percentage of the fair market value that is determined by local assessors to be the total taxable value of land and additions on the property. | Land | Improvement |
|---|---|---|---|---|
| 2024 | $6,714 | $394,057 | $80,043 | $314,014 |
| 2023 | $6,213 | $386,331 | $78,474 | $307,857 |
| 2022 | $6,177 | $378,756 | $76,935 | $301,821 |
| 2021 | $6,118 | $371,329 | $75,426 | $295,903 |
| 2020 | $6,093 | $367,522 | $74,653 | $292,869 |
| 2019 | $5,972 | $360,315 | $73,189 | $287,126 |
| 2018 | $6,011 | $353,250 | $71,754 | $281,496 |
| 2017 | $5,961 | $346,323 | $70,347 | $275,976 |
| 2016 | $5,870 | $339,533 | $68,968 | $270,565 |
| 2015 | $5,801 | $334,433 | $67,932 | $266,501 |
| 2014 | $5,789 | $327,882 | $66,601 | $261,281 |
Source: Public Records
Map
Nearby Homes
- 18113 Raymond Ct
- 930 N Forest Ave
- 18233 Montgomery Ave
- 1076 N Ironwood Ave
- 1636 W Jackson St
- 18045 Foothill Blvd
- 17848 17858 Foothill Blvd
- 658 N Quince Ave
- 1256 W Morgan St
- 250 N Linden Ave Unit 57
- 250 N Linden Ave Unit 312
- 250 N Linden Ave Unit 2
- 250 N Linden Ave Unit 129
- 250 N Linden Ave Unit 141
- 17651 Fairfax St
- 8019 Alder Ave
- 1204 W Victoria St
- 862 N Martin St
- 17603 Fairfax St
- 7740 Lombardy Ave
- 7769 Freesia Way
- 7759 Freesia Way
- 7777 Freesia Way
- 7787 Freesia Way
- 7749 Freesia Way
- 7741 Freesia Way
- 7795 Freesia Way Unit 10
- 7795 Freesia Way
- 7770 Freesia Way
- 7760 Freesia Way
- 7780 Freesia Way
- 7784 Maple Ave
- 7792 Freesia Way
- 18246 Fairview Dr
- 7740 Freesia Way Unit 14
- 7740 Freesia Way
- 18258 Fairview Dr
- 18234 Fairview Dr
- 7790 Maple Ave
- 7723 Freesia Way