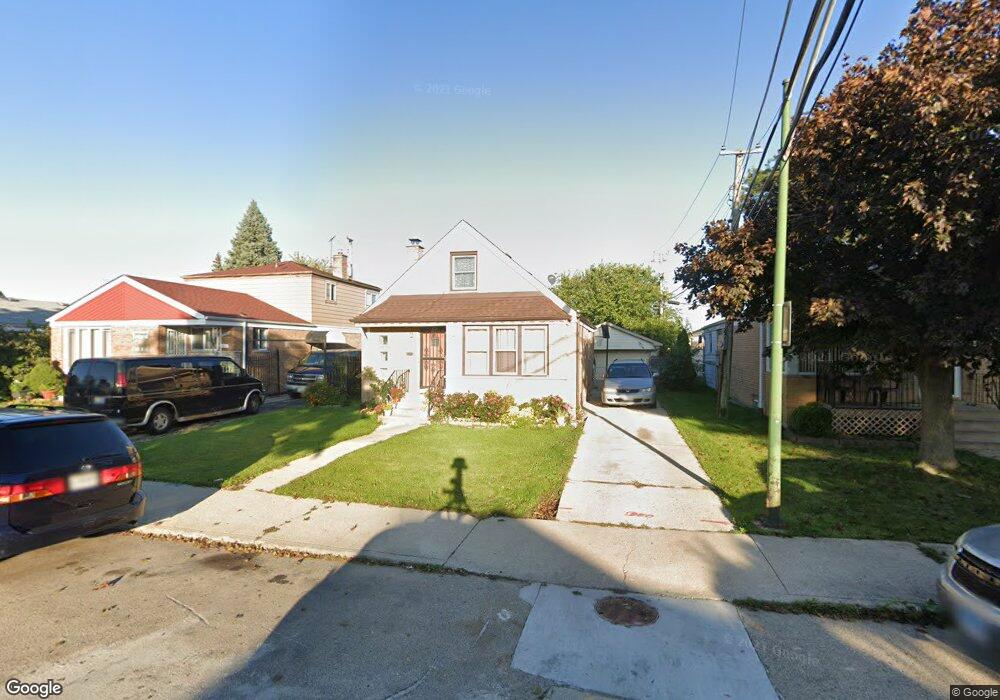
7769 S Karlov Ave Chicago, IL 60652
Scottsdale NeighborhoodEstimated Value: $277,000 - $296,000
4
Beds
2
Baths
1,450
Sq Ft
$197/Sq Ft
Est. Value
About This Home
This home is located at 7769 S Karlov Ave, Chicago, IL 60652 and is currently estimated at $285,792, approximately $197 per square foot. 7769 S Karlov Ave is a home located in Cook County with nearby schools including Stevenson Elementary School, Bogan Computer Technical High School, and St Bede-Venerable School.
Ownership History
Date
Name
Owned For
Owner Type
Purchase Details
Closed on
Nov 28, 2012
Sold by
Jaramillo Fabiola
Bought by
Yasin
Current Estimated Value
Purchase Details
Closed on
Feb 15, 2008
Sold by
Miracle Laura J
Bought by
Jaramillo Fabiola
Home Financials for this Owner
Home Financials are based on the most recent Mortgage that was taken out on this home.
Original Mortgage
$204,250
Interest Rate
5.75%
Mortgage Type
Unknown
Purchase Details
Closed on
Feb 11, 2008
Sold by
Miracle Kathleen Marie
Bought by
Miracle Laura J and The Kathleen M Miracle Obra 93 Special N
Home Financials for this Owner
Home Financials are based on the most recent Mortgage that was taken out on this home.
Original Mortgage
$204,250
Interest Rate
5.75%
Mortgage Type
Unknown
Purchase Details
Closed on
Apr 9, 2007
Sold by
Cheevers Gerald James
Bought by
Cheevers Gerald James and Miracle Laura J
Create a Home Valuation Report for This Property
The Home Valuation Report is an in-depth analysis detailing your home's value as well as a comparison with similar homes in the area
Home Values in the Area
Average Home Value in this Area
Purchase History
| Date | Buyer | Sale Price | Title Company |
|---|---|---|---|
| Yasin | $105,000 | None Available | |
| Jaramillo Fabiola | $216,000 | Ticor Title Insurance | |
| Jaramillo Fabiola | -- | Ticor Title Insurance | |
| Jaramillo Fabiola | -- | Ticor Title Insurance | |
| Jaramillo Fabiola | -- | Ticor Title Insurance | |
| Jaramillo Fabiola | -- | Ticor Title Insurance | |
| Miracle Laura J | -- | Ticor Title Insurance | |
| Cheevers Gerald James | -- | None Available |
Source: Public Records
Mortgage History
| Date | Status | Borrower | Loan Amount |
|---|---|---|---|
| Previous Owner | Jaramillo Fabiola | $204,250 |
Source: Public Records
Tax History Compared to Growth
Tax History
| Year | Tax Paid | Tax Assessment Tax Assessment Total Assessment is a certain percentage of the fair market value that is determined by local assessors to be the total taxable value of land and additions on the property. | Land | Improvement |
|---|---|---|---|---|
| 2024 | $4,667 | $22,000 | $2,580 | $19,420 |
| 2023 | $4,551 | $22,000 | $3,440 | $18,560 |
| 2022 | $4,551 | $22,000 | $3,440 | $18,560 |
| 2021 | $4,424 | $22,000 | $3,440 | $18,560 |
| 2020 | $3,282 | $14,637 | $3,440 | $11,197 |
| 2019 | $3,325 | $16,447 | $3,440 | $13,007 |
| 2018 | $3,270 | $16,447 | $3,440 | $13,007 |
| 2017 | $2,816 | $12,997 | $3,010 | $9,987 |
| 2016 | $2,620 | $12,997 | $3,010 | $9,987 |
| 2015 | $2,399 | $12,997 | $3,010 | $9,987 |
| 2014 | $2,190 | $11,713 | $2,795 | $8,918 |
| 2013 | $2,147 | $11,713 | $2,795 | $8,918 |
Source: Public Records
Map
Nearby Homes
- 7932 S Pulaski Rd Unit 301
- 3813 W 78th St
- 7964 S Tripp Ave
- 4222 W 77th St Unit 202
- 4222 W 77th St Unit 204
- 4244 W 77th St Unit 102
- 3827 W Hayford St
- 4300 W Ford City Dr Unit A1301
- 8100 S Kildare Ave
- 7917 S Kostner Ave
- 4350 W Ford City Dr Unit B1402
- 4263 W 81st St
- 3928 W 82nd Place
- 4327 W 81st St
- 3631 W 80th Place
- 3720 W 82nd St
- 3617 W 80th Place
- 3826 W 83rd St
- 7746 S Kolmar Ave
- 3644 W 82nd St
- 7765 S Karlov Ave
- 7773 S Karlov Ave
- 7759 S Karlov Ave
- 7777 S Karlov Ave
- 7768 S Komensky Ave
- 7764 S Komensky Ave
- 7774 S Komensky Ave
- 7755 S Karlov Ave
- 7760 S Komensky Ave
- 7781 S Karlov Ave
- 7780 S Komensky Ave
- 7766 S Karlov Ave
- 7770 S Karlov Ave
- 7762 S Karlov Ave
- 7754 S Komensky Ave
- 7774 S Karlov Ave
- 7800 S Komensky Ave
- 7751 S Karlov Ave
- 7758 S Karlov Ave
- 7750 S Komensky Ave