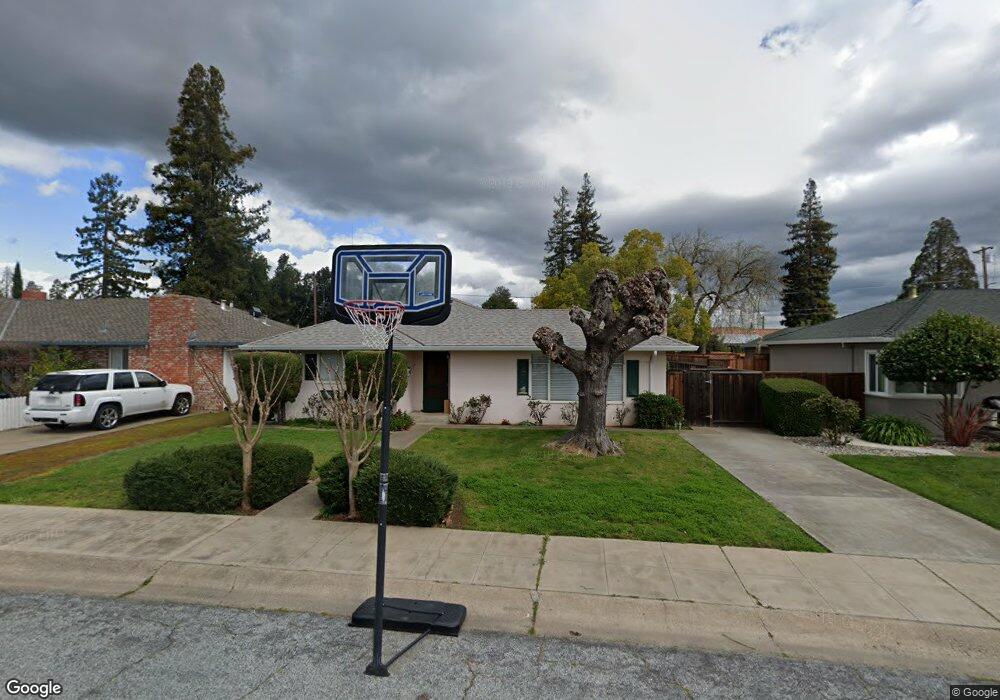
7770 Rea St Gilroy, CA 95020
Estimated Value: $878,729 - $1,061,000
3
Beds
1
Bath
1,344
Sq Ft
$725/Sq Ft
Est. Value
About This Home
This home is located at 7770 Rea St, Gilroy, CA 95020 and is currently estimated at $974,932, approximately $725 per square foot. 7770 Rea St is a home located in Santa Clara County with nearby schools including El Roble Elementary School, Brownell Middle School, and Solorsano Middle School.
Ownership History
Date
Name
Owned For
Owner Type
Purchase Details
Closed on
Jan 9, 2019
Sold by
Glathe John P and Seeds Carol B
Bought by
Glathe John P and Seeds Carol B
Current Estimated Value
Purchase Details
Closed on
May 30, 2003
Sold by
Seeds Carol B
Bought by
Glathe John P and Seeds Carol B
Purchase Details
Closed on
Apr 26, 1999
Sold by
Nusret Yurutucu
Bought by
Seeds Carol B
Create a Home Valuation Report for This Property
The Home Valuation Report is an in-depth analysis detailing your home's value as well as a comparison with similar homes in the area
Home Values in the Area
Average Home Value in this Area
Purchase History
| Date | Buyer | Sale Price | Title Company |
|---|---|---|---|
| Glathe John P | -- | None Available | |
| Glathe John P | -- | None Available | |
| Glathe John P | -- | -- | |
| Seeds Carol B | $282,000 | Chicago Title Co |
Source: Public Records
Tax History
| Year | Tax Paid | Tax Assessment Tax Assessment Total Assessment is a certain percentage of the fair market value that is determined by local assessors to be the total taxable value of land and additions on the property. | Land | Improvement |
|---|---|---|---|---|
| 2025 | $5,441 | $442,074 | $156,761 | $285,313 |
| 2024 | $5,441 | $433,407 | $153,688 | $279,719 |
| 2023 | $5,409 | $424,910 | $150,675 | $274,235 |
| 2022 | $5,320 | $416,579 | $147,721 | $268,858 |
| 2021 | $5,296 | $408,412 | $144,825 | $263,587 |
| 2020 | $5,238 | $404,225 | $143,340 | $260,885 |
| 2019 | $5,189 | $396,300 | $140,530 | $255,770 |
| 2018 | $4,848 | $388,530 | $137,775 | $250,755 |
| 2017 | $4,949 | $380,913 | $135,074 | $245,839 |
| 2016 | $4,846 | $373,445 | $132,426 | $241,019 |
| 2015 | $4,573 | $367,836 | $130,437 | $237,399 |
| 2014 | $4,545 | $360,631 | $127,882 | $232,749 |
Source: Public Records
Map
Nearby Homes
- 7821 Santa Theresa Dr
- 704 Tennyson Dr
- 7681 Hanna St
- 60 Monte Vista Way
- 622 Broadway
- 620 Broadway
- 626 Broadway
- 7630 Hanna St
- 7691 Church St Unit B
- 700 Eschenburg Dr
- 7460 Miller Ave
- 7490 Santa Theresa Dr Unit 10
- 7384 Ailes Ct
- 194 4th St
- 7376 Ailes Ct
- 925 Blake Ct
- 7360 Ailes Ct
- 7351 Princevalle St Unit Homesite 18
- 7711 Monterey St
- 760 Welburn Ave
Your Personal Tour Guide
Ask me questions while you tour the home.