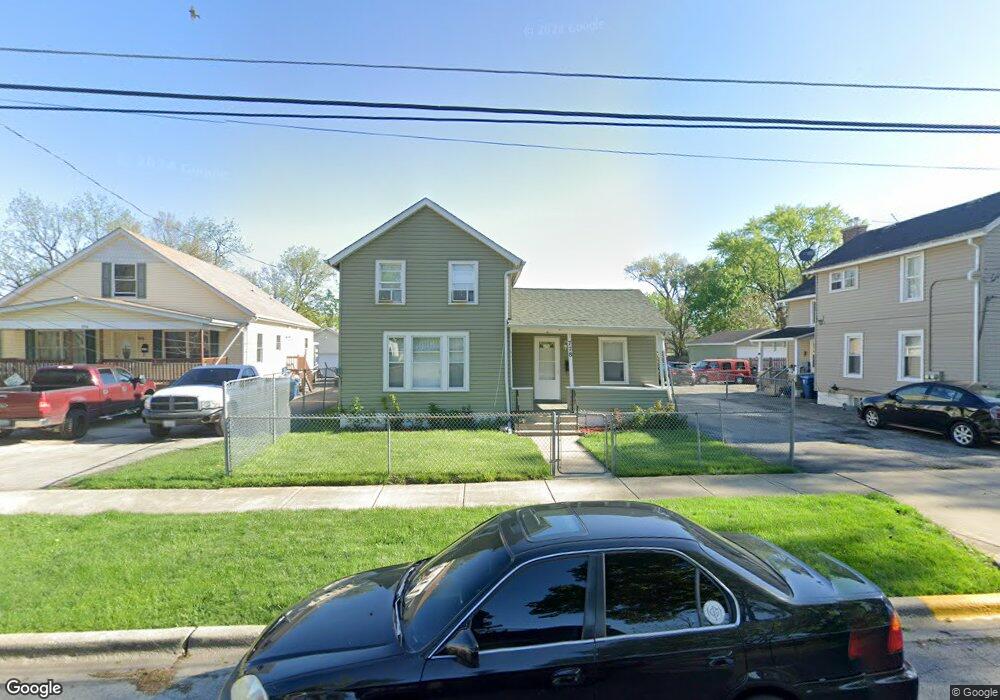
778 Fulton St Aurora, IL 60505
McCarty Burlington NeighborhoodEstimated Value: $212,017 - $253,000
2
Beds
1
Bath
1,224
Sq Ft
$186/Sq Ft
Est. Value
About This Home
This home is located at 778 Fulton St, Aurora, IL 60505 and is currently estimated at $228,004, approximately $186 per square foot. 778 Fulton St is a home located in Kane County with nearby schools including Edna Rollins Elementary School, Simmons Middle School, and East Aurora High School.
Ownership History
Date
Name
Owned For
Owner Type
Purchase Details
Closed on
May 18, 1999
Sold by
Hud
Bought by
Salazar Bruno F and Salazar Juan
Current Estimated Value
Home Financials for this Owner
Home Financials are based on the most recent Mortgage that was taken out on this home.
Original Mortgage
$37,800
Outstanding Balance
$9,726
Interest Rate
6.99%
Estimated Equity
$218,278
Purchase Details
Closed on
Dec 4, 1998
Sold by
Castro Eugenio and Castro Rosa
Bought by
Hud
Create a Home Valuation Report for This Property
The Home Valuation Report is an in-depth analysis detailing your home's value as well as a comparison with similar homes in the area
Home Values in the Area
Average Home Value in this Area
Purchase History
| Date | Buyer | Sale Price | Title Company |
|---|---|---|---|
| Salazar Bruno F | -- | Stewart Title | |
| Hud | -- | -- |
Source: Public Records
Mortgage History
| Date | Status | Borrower | Loan Amount |
|---|---|---|---|
| Open | Salazar Bruno F | $37,800 |
Source: Public Records
Tax History Compared to Growth
Tax History
| Year | Tax Paid | Tax Assessment Tax Assessment Total Assessment is a certain percentage of the fair market value that is determined by local assessors to be the total taxable value of land and additions on the property. | Land | Improvement |
|---|---|---|---|---|
| 2024 | $3,346 | $48,815 | $7,372 | $41,443 |
| 2023 | $3,259 | $43,616 | $6,587 | $37,029 |
| 2022 | $3,024 | $39,796 | $6,010 | $33,786 |
| 2021 | $2,991 | $37,050 | $5,595 | $31,455 |
| 2020 | $2,862 | $34,414 | $5,197 | $29,217 |
| 2019 | $3,142 | $35,662 | $4,815 | $30,847 |
| 2018 | $2,936 | $32,245 | $4,454 | $27,791 |
| 2017 | $2,746 | $28,002 | $4,104 | $23,898 |
| 2016 | $2,547 | $24,206 | $3,518 | $20,688 |
| 2015 | -- | $22,382 | $3,025 | $19,357 |
| 2014 | -- | $21,397 | $2,780 | $18,617 |
| 2013 | -- | $24,832 | $2,656 | $22,176 |
Source: Public Records
Map
Nearby Homes