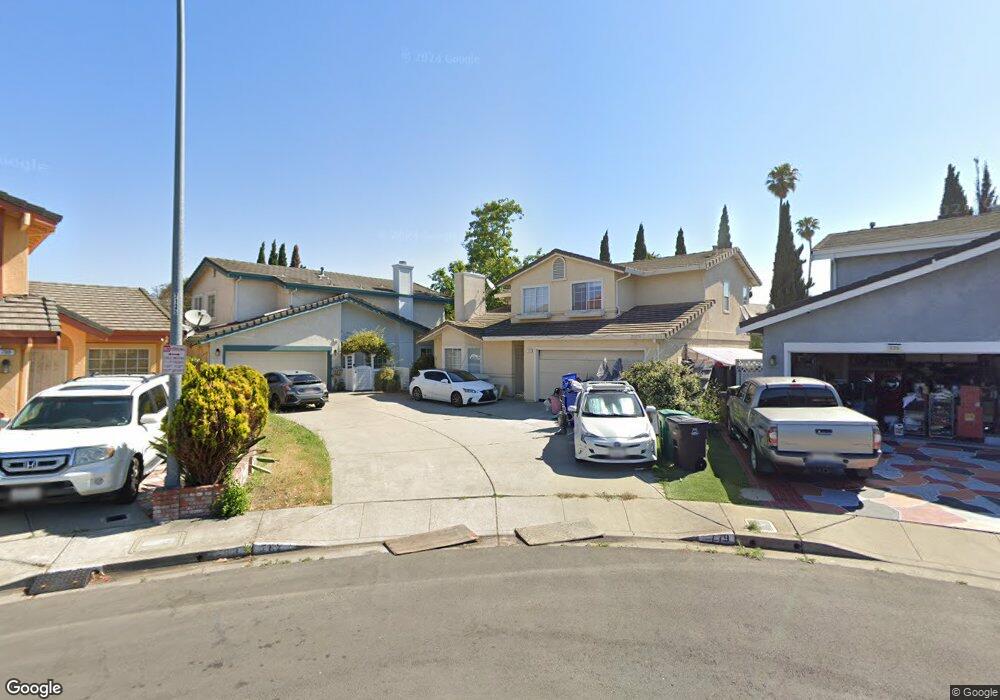
779 Horton Ct Hayward, CA 94544
Tennyson-Alquire NeighborhoodEstimated Value: $819,851 - $944,000
3
Beds
3
Baths
1,445
Sq Ft
$603/Sq Ft
Est. Value
About This Home
This home is located at 779 Horton Ct, Hayward, CA 94544 and is currently estimated at $870,963, approximately $602 per square foot. 779 Horton Ct is a home located in Alameda County with nearby schools including Ruus Elementary School, Cesar Chavez Middle School, and Tennyson High School.
Ownership History
Date
Name
Owned For
Owner Type
Purchase Details
Closed on
Feb 18, 2013
Sold by
Wang Sam Shengxiu and He Helen Hua
Bought by
Wang Sam Shengxiu and He Helen Hua
Current Estimated Value
Purchase Details
Closed on
May 10, 2012
Sold by
Deutsche Bank National Trust Company
Bought by
Wang Sam and He Helen
Purchase Details
Closed on
Mar 8, 2011
Sold by
Reynolds Claude
Bought by
Deutsche Bank National Trust Company
Purchase Details
Closed on
Nov 14, 2005
Sold by
Reynolds Sondra L
Bought by
Reynolds Claude
Purchase Details
Closed on
Apr 13, 2004
Sold by
Reynolds Claude and Cartwright Reynolds Sondra
Bought by
Reynolds Claude and Reynolds Sondra L
Purchase Details
Closed on
Sep 22, 1994
Sold by
Mission Peak Homes Inc
Bought by
Reynolds Claude and Cartwright Reynolds Sondra
Home Financials for this Owner
Home Financials are based on the most recent Mortgage that was taken out on this home.
Original Mortgage
$197,600
Interest Rate
5.37%
Create a Home Valuation Report for This Property
The Home Valuation Report is an in-depth analysis detailing your home's value as well as a comparison with similar homes in the area
Home Values in the Area
Average Home Value in this Area
Purchase History
| Date | Buyer | Sale Price | Title Company |
|---|---|---|---|
| Wang Sam Shengxiu | -- | None Available | |
| Wang Sam | $290,000 | Servicelink | |
| Deutsche Bank National Trust Company | $288,000 | None Available | |
| Reynolds Claude | -- | -- | |
| Reynolds Claude | -- | -- | |
| Reynolds Claude | -- | -- | |
| Reynolds Claude | $208,000 | Fidelity National Title Co |
Source: Public Records
Mortgage History
| Date | Status | Borrower | Loan Amount |
|---|---|---|---|
| Previous Owner | Reynolds Claude | $197,600 |
Source: Public Records
Tax History
| Year | Tax Paid | Tax Assessment Tax Assessment Total Assessment is a certain percentage of the fair market value that is determined by local assessors to be the total taxable value of land and additions on the property. | Land | Improvement |
|---|---|---|---|---|
| 2025 | $4,605 | $364,111 | $109,233 | $254,878 |
| 2024 | $4,605 | $356,973 | $107,092 | $249,881 |
| 2023 | $4,538 | $349,975 | $104,992 | $244,983 |
| 2022 | $4,452 | $343,113 | $102,934 | $240,179 |
| 2021 | $4,417 | $336,387 | $100,916 | $235,471 |
| 2020 | $4,369 | $332,941 | $99,882 | $233,059 |
| 2019 | $4,404 | $326,415 | $97,924 | $228,491 |
| 2018 | $4,140 | $320,017 | $96,005 | $224,012 |
| 2017 | $4,048 | $313,743 | $94,123 | $219,620 |
| 2016 | $3,810 | $307,591 | $92,277 | $215,314 |
| 2015 | $3,736 | $302,974 | $90,892 | $212,082 |
| 2014 | $3,554 | $297,040 | $89,112 | $207,928 |
Source: Public Records
Map
Nearby Homes
- 27796 Vasona Ct Unit 2
- 27906 Thackeray Ave
- 27781 Dickens Ave
- 28538 Huntwood Ave
- 1177 Thiel Rd
- 139 Mars Ave Unit 139
- 27505 Tampa Ave Unit 39
- 28315 Rochelle Ave
- 27777 Pistachio Ct
- 27773 Pistachio Ct
- 29026 Hillview St
- 29255 Harpoon Way
- 761 Shepherd Ave
- 27720 Seminole Way
- 29131 Delgado Rd
- 29273 Nantucket Way
- 1587 de Lemos Ave
- 933 New England Village Dr
- 29133 De la Cruz Rd
- 1438 Buckingham Way
Your Personal Tour Guide
Ask me questions while you tour the home.