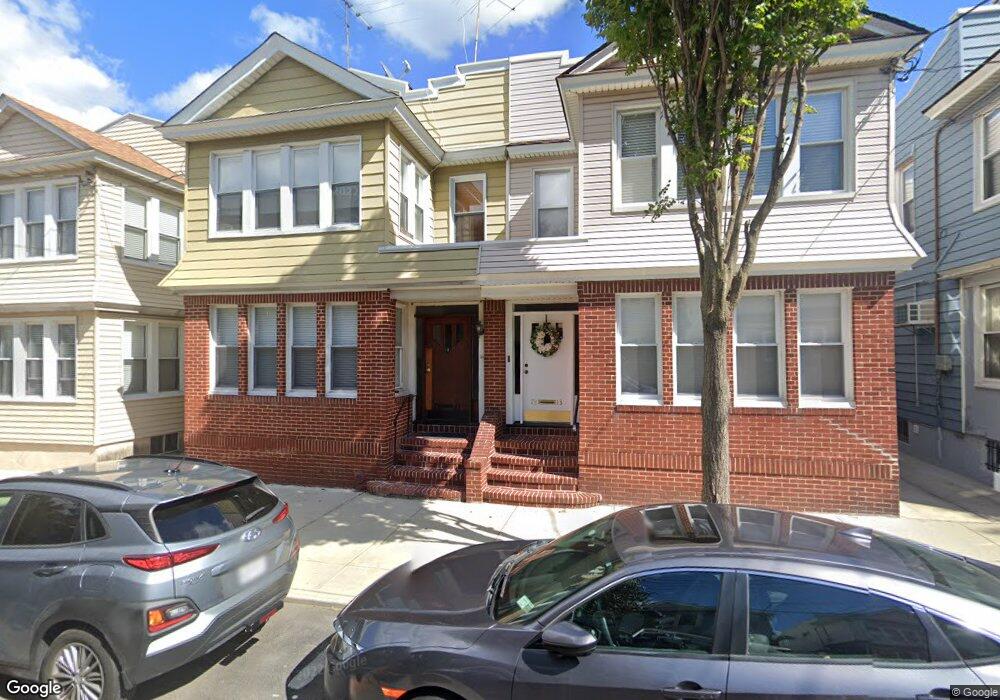
78-11 83rd St Flushing, NY 11385
Glendale NeighborhoodEstimated Value: $864,469 - $1,192,000
3
Beds
1
Bath
2,256
Sq Ft
$469/Sq Ft
Est. Value
About This Home
This home is located at 78-11 83rd St, Flushing, NY 11385 and is currently estimated at $1,059,117, approximately $469 per square foot. 78-11 83rd St is a home located in Queens County with nearby schools including P.S./I.S. 113 Anthony J. Pranzo School, Queens Metropolitan High School, and Elm Community Charter School.
Ownership History
Date
Name
Owned For
Owner Type
Purchase Details
Closed on
Aug 6, 1999
Sold by
Bruno Audrey and Gotzen Walter
Bought by
Sorrentino Pasquale and Sorrentino Raffaella
Current Estimated Value
Home Financials for this Owner
Home Financials are based on the most recent Mortgage that was taken out on this home.
Original Mortgage
$207,000
Outstanding Balance
$58,788
Interest Rate
7.5%
Estimated Equity
$1,000,329
Create a Home Valuation Report for This Property
The Home Valuation Report is an in-depth analysis detailing your home's value as well as a comparison with similar homes in the area
Home Values in the Area
Average Home Value in this Area
Purchase History
| Date | Buyer | Sale Price | Title Company |
|---|---|---|---|
| Sorrentino Pasquale | $277,000 | -- |
Source: Public Records
Mortgage History
| Date | Status | Borrower | Loan Amount |
|---|---|---|---|
| Open | Sorrentino Pasquale | $207,000 |
Source: Public Records
Tax History Compared to Growth
Tax History
| Year | Tax Paid | Tax Assessment Tax Assessment Total Assessment is a certain percentage of the fair market value that is determined by local assessors to be the total taxable value of land and additions on the property. | Land | Improvement |
|---|---|---|---|---|
| 2025 | $8,684 | $43,236 | $12,761 | $30,475 |
| 2024 | $8,684 | $43,236 | $11,982 | $31,254 |
| 2023 | $8,618 | $42,906 | $12,162 | $30,744 |
| 2022 | $8,081 | $55,440 | $17,160 | $38,280 |
| 2021 | $8,037 | $57,960 | $17,160 | $40,800 |
| 2020 | $7,626 | $55,980 | $17,160 | $38,820 |
| 2019 | $7,537 | $49,740 | $17,160 | $32,580 |
| 2018 | $7,289 | $35,755 | $13,263 | $22,492 |
| 2017 | $6,876 | $33,732 | $12,897 | $20,835 |
| 2016 | $6,362 | $33,732 | $12,897 | $20,835 |
| 2015 | $3,618 | $30,025 | $13,918 | $16,107 |
| 2014 | $3,618 | $30,025 | $15,627 | $14,398 |
Source: Public Records
Map
Nearby Homes