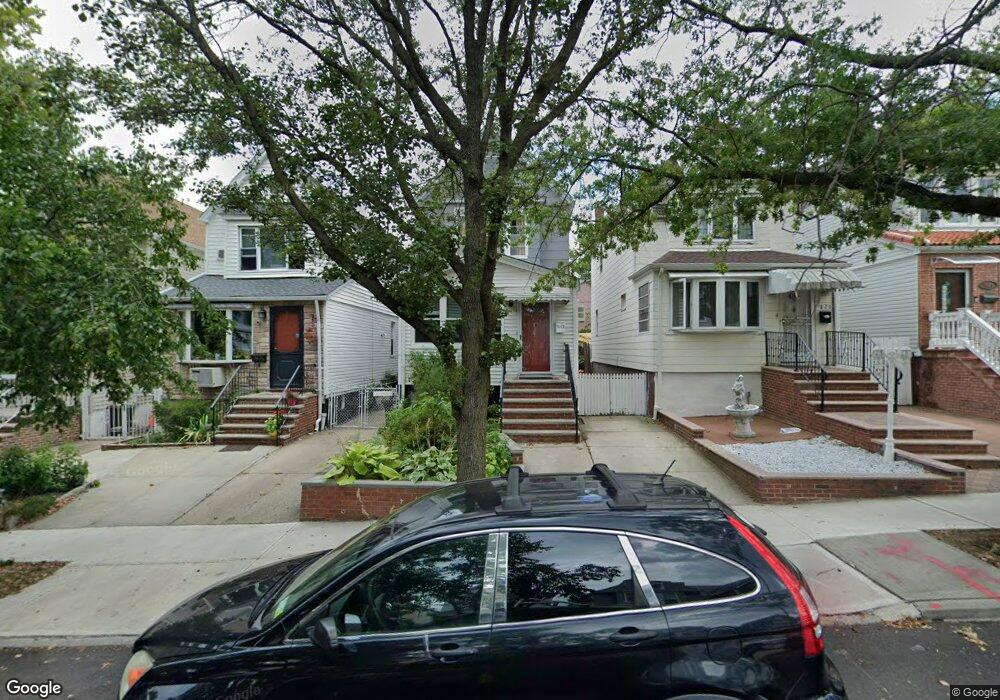
78-23 62nd St Flushing, NY 11385
Glendale NeighborhoodEstimated Value: $876,000 - $885,000
3
Beds
2
Baths
1,320
Sq Ft
$666/Sq Ft
Est. Value
About This Home
This home is located at 78-23 62nd St, Flushing, NY 11385 and is currently estimated at $879,667, approximately $666 per square foot. 78-23 62nd St is a home located in Queens County with nearby schools including P.S. 91 - Richard Arkwright, Joseph F. Quinn Intermediate School 77, and Elm Community Charter School.
Ownership History
Date
Name
Owned For
Owner Type
Purchase Details
Closed on
Jul 24, 2019
Sold by
Ortega Maria and Ortega Raymond
Bought by
Koelbl Hannah and Koelbl Markus
Current Estimated Value
Home Financials for this Owner
Home Financials are based on the most recent Mortgage that was taken out on this home.
Original Mortgage
$240,000
Outstanding Balance
$209,870
Interest Rate
3.73%
Mortgage Type
New Conventional
Estimated Equity
$669,797
Purchase Details
Closed on
May 4, 2005
Sold by
Auletta Diane
Bought by
Ortega Maria and Ortega Raymond
Create a Home Valuation Report for This Property
The Home Valuation Report is an in-depth analysis detailing your home's value as well as a comparison with similar homes in the area
Home Values in the Area
Average Home Value in this Area
Purchase History
| Date | Buyer | Sale Price | Title Company |
|---|---|---|---|
| Koelbl Hannah | $715,000 | -- | |
| Ortega Maria | $427,000 | -- |
Source: Public Records
Mortgage History
| Date | Status | Borrower | Loan Amount |
|---|---|---|---|
| Open | Koelbl Hannah | $240,000 |
Source: Public Records
Tax History Compared to Growth
Tax History
| Year | Tax Paid | Tax Assessment Tax Assessment Total Assessment is a certain percentage of the fair market value that is determined by local assessors to be the total taxable value of land and additions on the property. | Land | Improvement |
|---|---|---|---|---|
| 2025 | $6,653 | $35,110 | $8,556 | $26,554 |
| 2024 | $5,769 | $33,125 | $9,265 | $23,860 |
| 2023 | $6,277 | $31,252 | $8,858 | $22,394 |
| 2022 | $5,037 | $47,100 | $12,720 | $34,380 |
| 2021 | $6,242 | $45,060 | $12,720 | $32,340 |
| 2020 | $6,193 | $39,600 | $12,720 | $26,880 |
| 2019 | $5,482 | $40,440 | $12,720 | $27,720 |
| 2018 | $5,011 | $26,043 | $8,876 | $17,167 |
| 2017 | $4,738 | $24,715 | $8,791 | $15,924 |
| 2016 | $4,631 | $24,715 | $8,791 | $15,924 |
| 2015 | $2,592 | $24,382 | $11,485 | $12,897 |
| 2014 | $2,592 | $23,004 | $12,834 | $10,170 |
Source: Public Records
Map
Nearby Homes
- 7817 64th St
- 78-30 62nd St
- 78-14 64th Place
- 62-22 80th Rd
- 62-53 80th Rd
- 7842 64th Ln
- 78-30 64th Ln
- 60-48 80th Ave
- 647 Cooper Ave
- 7818 65th St
- 7520 64th Place
- 75-16 62nd St
- 6510 80th Ave
- 5922 Cooper Ave
- 6020 Saint Felix Ave
- 60-27 Saint Felix Ave
- 74-40 65th St
- 65 Cooper Square Unit 3C
- 72-55 60th Ln
- 58-59 78th Ave