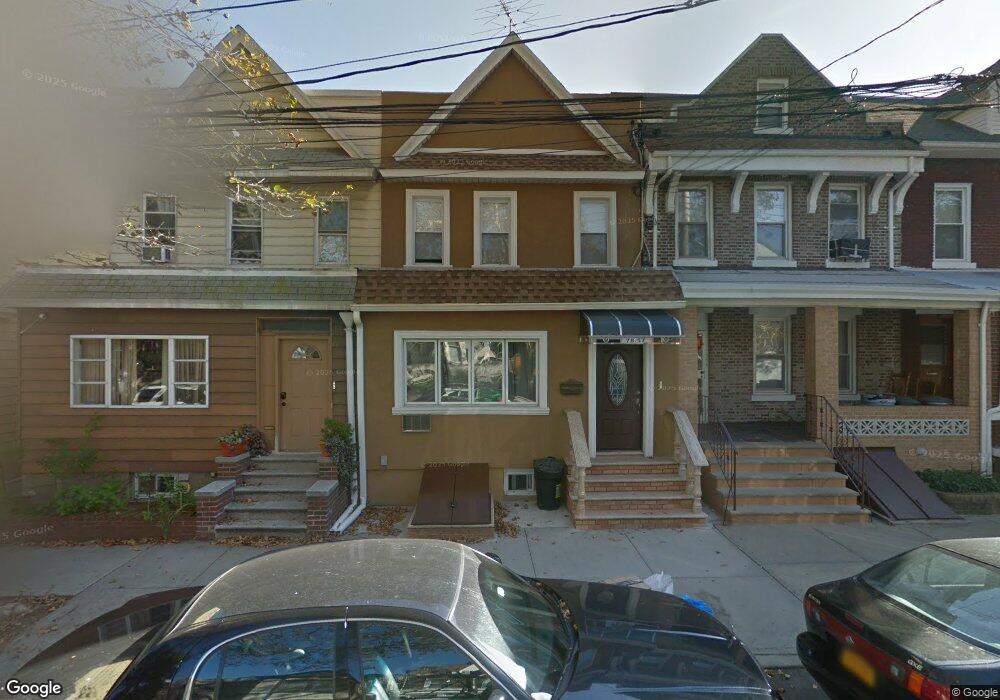
78-55 79th Ln Unit 2R Flushing, NY 11385
Glendale NeighborhoodEstimated Value: $839,683 - $1,167,000
3
Beds
1
Bath
1,000
Sq Ft
$1,063/Sq Ft
Est. Value
About This Home
This home is located at 78-55 79th Ln Unit 2R, Flushing, NY 11385 and is currently estimated at $1,063,421, approximately $1,063 per square foot. 78-55 79th Ln Unit 2R is a home located in Queens County with nearby schools including I.S. 119 the Glendale and Elm Community Charter School.
Ownership History
Date
Name
Owned For
Owner Type
Purchase Details
Closed on
Dec 12, 2013
Sold by
Milazzo Dominic and Milazzo Vita
Bought by
Hanna Tharwat S and Tanious Maha F
Current Estimated Value
Home Financials for this Owner
Home Financials are based on the most recent Mortgage that was taken out on this home.
Original Mortgage
$480,000
Outstanding Balance
$359,191
Interest Rate
4.24%
Mortgage Type
New Conventional
Estimated Equity
$704,230
Purchase Details
Closed on
Oct 22, 1987
Sold by
Morio Henrietta and Morio Robert John
Bought by
Milazzo Dominic and Milazzo Vita
Create a Home Valuation Report for This Property
The Home Valuation Report is an in-depth analysis detailing your home's value as well as a comparison with similar homes in the area
Home Values in the Area
Average Home Value in this Area
Purchase History
| Date | Buyer | Sale Price | Title Company |
|---|---|---|---|
| Hanna Tharwat S | $600,000 | -- | |
| Hanna Tharwat S | $600,000 | -- | |
| Milazzo Dominic | -- | -- | |
| Milazzo Dominic | -- | -- |
Source: Public Records
Mortgage History
| Date | Status | Borrower | Loan Amount |
|---|---|---|---|
| Open | Hanna Tharwat S | $480,000 | |
| Closed | Hanna Tharwat S | $480,000 |
Source: Public Records
Tax History Compared to Growth
Tax History
| Year | Tax Paid | Tax Assessment Tax Assessment Total Assessment is a certain percentage of the fair market value that is determined by local assessors to be the total taxable value of land and additions on the property. | Land | Improvement |
|---|---|---|---|---|
| 2025 | $8,448 | $45,145 | $13,895 | $31,250 |
| 2024 | $8,460 | $43,463 | $14,341 | $29,122 |
| 2023 | $7,955 | $41,006 | $11,813 | $29,193 |
| 2022 | $7,859 | $57,120 | $15,660 | $41,460 |
| 2021 | $8,096 | $49,860 | $15,660 | $34,200 |
| 2020 | $7,667 | $48,840 | $15,660 | $33,180 |
| 2019 | $7,284 | $41,820 | $15,660 | $26,160 |
| 2018 | $6,668 | $34,172 | $10,943 | $23,229 |
| 2017 | $6,632 | $34,006 | $12,225 | $21,781 |
| 2016 | $6,333 | $34,006 | $12,225 | $21,781 |
| 2015 | $3,650 | $31,351 | $15,178 | $16,173 |
| 2014 | $3,650 | $30,183 | $16,300 | $13,883 |
Source: Public Records
Map
Nearby Homes