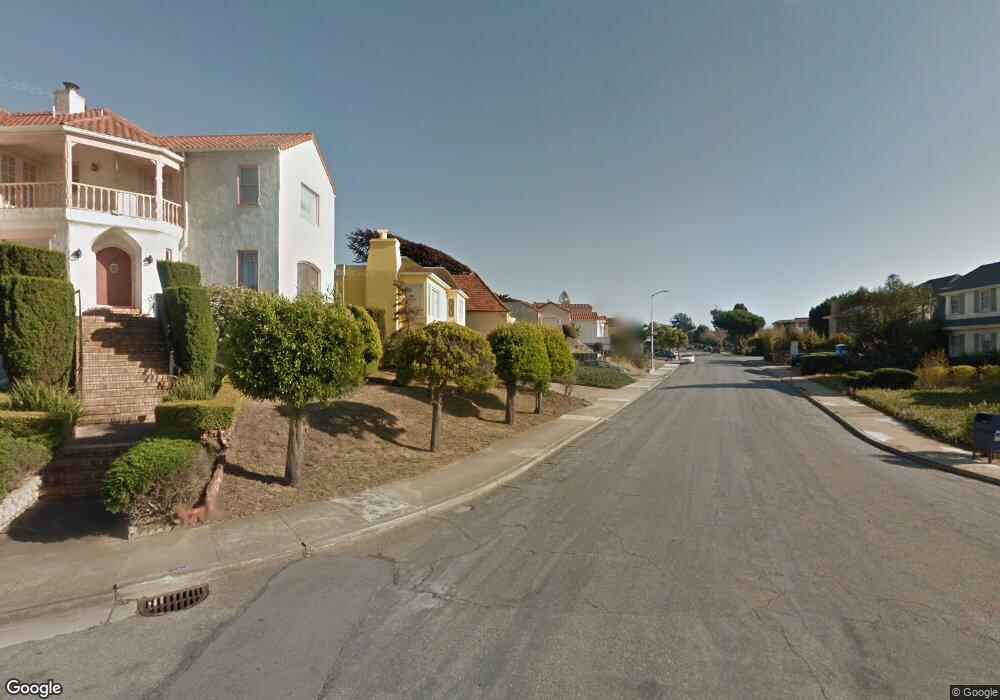
78 Alviso St San Francisco, CA 94127
Ingleside Terrace NeighborhoodEstimated Value: $1,541,649 - $2,199,000
4
Beds
2
Baths
1,940
Sq Ft
$994/Sq Ft
Est. Value
About This Home
This home is located at 78 Alviso St, San Francisco, CA 94127 and is currently estimated at $1,927,662, approximately $993 per square foot. 78 Alviso St is a home located in San Francisco County with nearby schools including Commodore Sloat Elementary School, Aptos Middle School, and St. Stephen School.
Ownership History
Date
Name
Owned For
Owner Type
Purchase Details
Closed on
Apr 2, 1999
Sold by
Chooey Johnny W and Chooey Anne M
Bought by
Chooey Johnny Wong and Chooey Anne Marie Lum
Current Estimated Value
Home Financials for this Owner
Home Financials are based on the most recent Mortgage that was taken out on this home.
Original Mortgage
$240,000
Interest Rate
6.36%
Purchase Details
Closed on
Mar 9, 1999
Sold by
Tru Chooey Johnny W and L Revocabl Anne M
Bought by
Chooey Johnny Wong and Chooey Anne Marie Lum
Home Financials for this Owner
Home Financials are based on the most recent Mortgage that was taken out on this home.
Original Mortgage
$240,000
Interest Rate
6.36%
Purchase Details
Closed on
Nov 28, 1994
Sold by
Chooey Johnny Wong and Chooey Anne Marie Lum
Bought by
Chooey Johnny Wong and Chooey Anne Marie Lum
Create a Home Valuation Report for This Property
The Home Valuation Report is an in-depth analysis detailing your home's value as well as a comparison with similar homes in the area
Home Values in the Area
Average Home Value in this Area
Purchase History
| Date | Buyer | Sale Price | Title Company |
|---|---|---|---|
| Chooey Johnny Wong | -- | -- | |
| Chooey Johnny Wong | -- | Old Republic Title Company | |
| Chooey Johnny Wong | -- | -- | |
| Chooey Johnny Wong | -- | -- |
Source: Public Records
Mortgage History
| Date | Status | Borrower | Loan Amount |
|---|---|---|---|
| Closed | Chooey Johnny Wong | $240,000 |
Source: Public Records
Tax History Compared to Growth
Tax History
| Year | Tax Paid | Tax Assessment Tax Assessment Total Assessment is a certain percentage of the fair market value that is determined by local assessors to be the total taxable value of land and additions on the property. | Land | Improvement |
|---|---|---|---|---|
| 2025 | $5,634 | $488,067 | $287,100 | $200,967 |
| 2024 | $5,634 | $478,498 | $281,471 | $197,027 |
| 2023 | $5,553 | $469,116 | $275,952 | $193,164 |
| 2022 | $5,454 | $459,919 | $270,542 | $189,377 |
| 2021 | $5,963 | $450,902 | $265,238 | $185,664 |
| 2020 | $6,005 | $446,280 | $262,519 | $183,761 |
| 2019 | $5,801 | $437,530 | $257,372 | $180,158 |
| 2018 | $5,606 | $428,952 | $252,326 | $176,626 |
| 2017 | $5,240 | $420,542 | $247,379 | $173,163 |
| 2016 | $5,131 | $412,297 | $242,529 | $169,768 |
| 2015 | $5,065 | $406,104 | $238,886 | $167,218 |
| 2014 | $4,931 | $398,150 | $234,207 | $163,943 |
Source: Public Records
Map
Nearby Homes