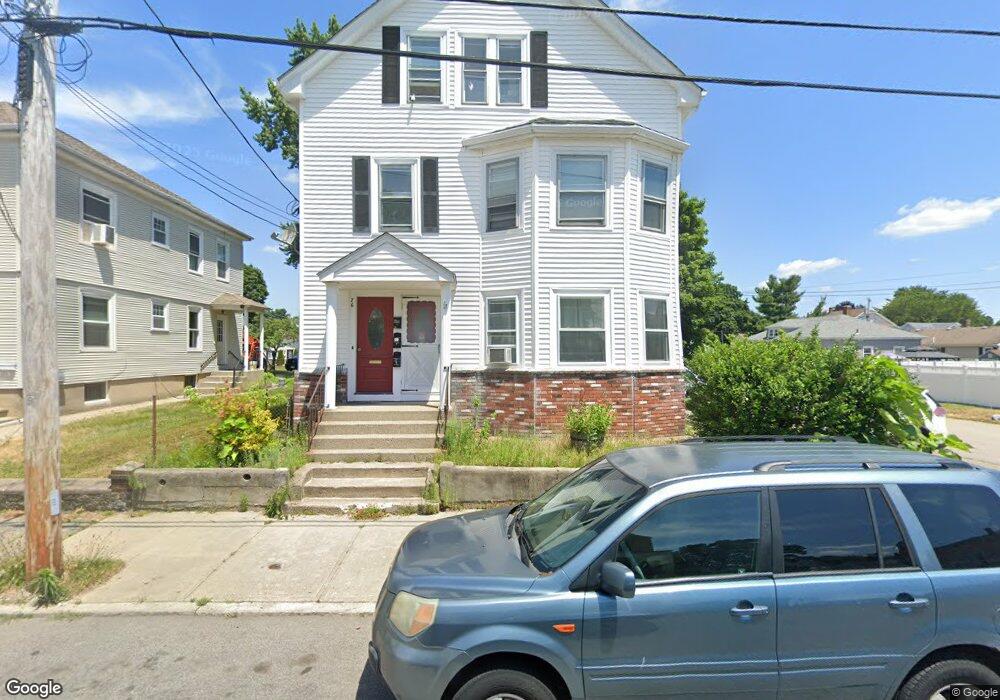
78 Chaplin St Pawtucket, RI 02861
Darlington NeighborhoodEstimated Value: $409,526 - $640,000
5
Beds
3
Baths
2,613
Sq Ft
$207/Sq Ft
Est. Value
About This Home
This home is located at 78 Chaplin St, Pawtucket, RI 02861 and is currently estimated at $541,882, approximately $207 per square foot. 78 Chaplin St is a home located in Providence County with nearby schools including St Cecilia School and Saint Raphael Academy.
Ownership History
Date
Name
Owned For
Owner Type
Purchase Details
Closed on
Jun 16, 2023
Sold by
Kabli Kandi L
Bought by
Kabli Ft and Kabli
Current Estimated Value
Purchase Details
Closed on
Jan 29, 2010
Sold by
Hebert Philip J
Bought by
Kabli Dandi L
Home Financials for this Owner
Home Financials are based on the most recent Mortgage that was taken out on this home.
Original Mortgage
$80,362
Interest Rate
4.95%
Mortgage Type
Purchase Money Mortgage
Create a Home Valuation Report for This Property
The Home Valuation Report is an in-depth analysis detailing your home's value as well as a comparison with similar homes in the area
Home Values in the Area
Average Home Value in this Area
Purchase History
| Date | Buyer | Sale Price | Title Company |
|---|---|---|---|
| Kabli Ft | -- | None Available | |
| Kabli Dandi L | $107,000 | -- |
Source: Public Records
Mortgage History
| Date | Status | Borrower | Loan Amount |
|---|---|---|---|
| Previous Owner | Kabli Dandi L | $80,362 | |
| Previous Owner | Kabli Dandi L | $25,000 |
Source: Public Records
Tax History
| Year | Tax Paid | Tax Assessment Tax Assessment Total Assessment is a certain percentage of the fair market value that is determined by local assessors to be the total taxable value of land and additions on the property. | Land | Improvement |
|---|---|---|---|---|
| 2025 | $5,373 | $408,600 | $120,100 | $288,500 |
| 2024 | $5,042 | $408,600 | $120,100 | $288,500 |
| 2023 | $4,723 | $278,800 | $75,100 | $203,700 |
| 2022 | $4,623 | $278,800 | $75,100 | $203,700 |
| 2021 | $4,623 | $278,800 | $75,100 | $203,700 |
| 2020 | $4,055 | $194,100 | $59,300 | $134,800 |
| 2019 | $4,055 | $194,100 | $59,300 | $134,800 |
| 2018 | $3,907 | $194,100 | $59,300 | $134,800 |
| 2017 | $3,510 | $154,500 | $47,800 | $106,700 |
| 2016 | $3,382 | $154,500 | $47,800 | $106,700 |
| 2015 | $3,382 | $154,500 | $47,800 | $106,700 |
| 2014 | $3,348 | $145,200 | $47,800 | $97,400 |
Source: Public Records
Map
Nearby Homes