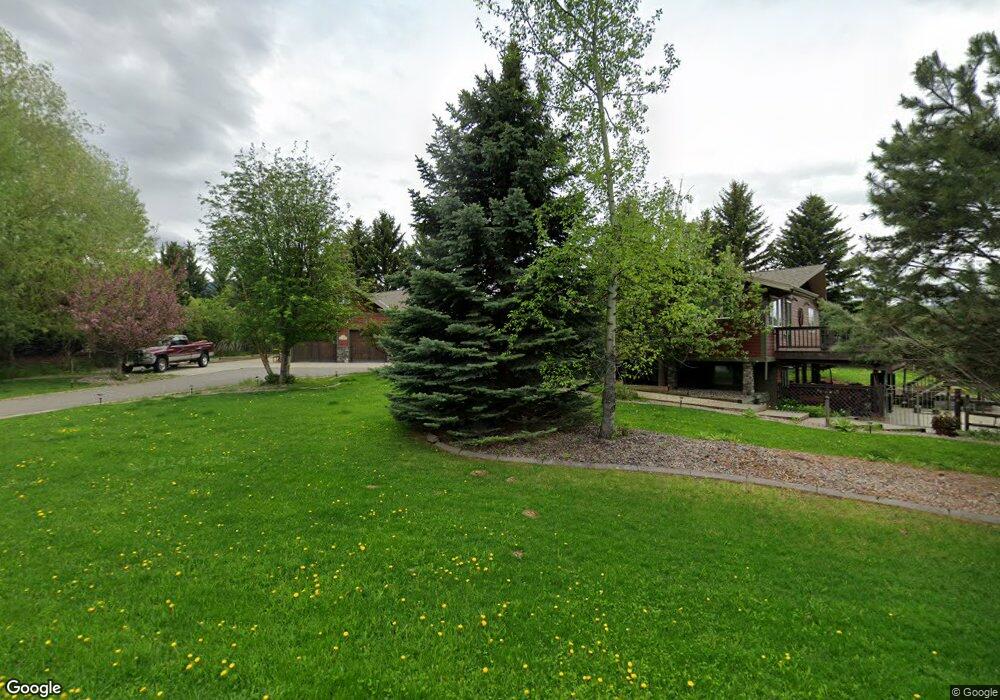
78 Hitching Post Rd Bozeman, MT 59715
Estimated Value: $1,052,000 - $1,234,000
5
Beds
3
Baths
3,324
Sq Ft
$348/Sq Ft
Est. Value
About This Home
This home is located at 78 Hitching Post Rd, Bozeman, MT 59715 and is currently estimated at $1,155,615, approximately $347 per square foot. 78 Hitching Post Rd is a home located in Gallatin County with nearby schools including Morning Star School, Sacajawea Middle School, and Bozeman High School.
Ownership History
Date
Name
Owned For
Owner Type
Purchase Details
Closed on
Jul 7, 2024
Sold by
Beachwood Holdings Llc
Bought by
Seglem Jeremy Maxwell
Current Estimated Value
Purchase Details
Closed on
Jun 21, 2013
Sold by
Pringle Stephen C
Bought by
Chambers Linda J
Purchase Details
Closed on
Mar 27, 2009
Sold by
Coppack Peter R and Coppack Mary Jo C
Bought by
Pringle Stephen C and Chambers Linda J
Home Financials for this Owner
Home Financials are based on the most recent Mortgage that was taken out on this home.
Original Mortgage
$175,001
Interest Rate
5.15%
Mortgage Type
Unknown
Purchase Details
Closed on
Jun 27, 2005
Sold by
Hendricks Cary P and Hendricks Rachel J
Bought by
Coppack Peter R and Coppack Mary Jo C
Home Financials for this Owner
Home Financials are based on the most recent Mortgage that was taken out on this home.
Original Mortgage
$386,000
Interest Rate
5.25%
Mortgage Type
Unknown
Create a Home Valuation Report for This Property
The Home Valuation Report is an in-depth analysis detailing your home's value as well as a comparison with similar homes in the area
Home Values in the Area
Average Home Value in this Area
Purchase History
| Date | Buyer | Sale Price | Title Company |
|---|---|---|---|
| Seglem Jeremy Maxwell | -- | Security Title | |
| Chambers Linda J | -- | None Available | |
| Pringle Stephen C | -- | Security Title Company | |
| Coppack Peter R | -- | Stc |
Source: Public Records
Mortgage History
| Date | Status | Borrower | Loan Amount |
|---|---|---|---|
| Previous Owner | Pringle Stephen C | $175,001 | |
| Previous Owner | Coppack Peter R | $386,000 |
Source: Public Records
Tax History Compared to Growth
Tax History
| Year | Tax Paid | Tax Assessment Tax Assessment Total Assessment is a certain percentage of the fair market value that is determined by local assessors to be the total taxable value of land and additions on the property. | Land | Improvement |
|---|---|---|---|---|
| 2025 | $4,312 | $1,095,200 | $0 | $0 |
| 2024 | $6,611 | $1,257,600 | $0 | $0 |
| 2023 | $6,554 | $1,257,600 | $0 | $0 |
| 2022 | $4,989 | $762,700 | $0 | $0 |
| 2021 | $5,561 | $762,700 | $0 | $0 |
| 2020 | $4,570 | $598,000 | $0 | $0 |
| 2019 | $4,502 | $598,000 | $0 | $0 |
| 2018 | $4,408 | $536,700 | $0 | $0 |
| 2017 | $4,186 | $536,700 | $0 | $0 |
| 2016 | $3,233 | $391,400 | $0 | $0 |
| 2015 | $3,253 | $391,400 | $0 | $0 |
| 2014 | $3,821 | $271,572 | $0 | $0 |
Source: Public Records
Map
Nearby Homes
- 41B E Hitching Post Rd Unit B
- 8472 Wagon Boss Rd
- 240 Horsetail Rd
- 8373 Goldenstein Ln
- 4510 Morning Sun Dr
- NHN Trooper Trail
- 4235 Graf St
- 11 Hitching Post Rd
- 585 Wildrose Ln
- 5041 S 3rd Ave
- 3726 Bungalow Ln
- Lot 129 Graf St
- TBD Jack Leg Ln
- 3300 E Graf St Unit 45
- 1301 Cambridge Dr
- 1605 Cambridge Dr
- 1517 Cambridge Dr
- 1525 Cambridge Dr
- 1617 Cambridge Dr
- 1621 Cambridge Dr
- 76 Hitching Post Rd
- 75 Hitching Post Rd
- 108 Hitching Post Rd
- 295 Cobble Creek Rd
- 73 Hitching Post Rd
- 74 Hitching Post Rd
- 111 Hitching Post Rd
- 71 Hitching Post Rd
- 155 Cobble Creek Rd
- 72 Hitching Post Rd
- 110 Hitching Post Rd
- 112 Hitching Post Rd
- 69 Hitching Post Rd
- 4675 Conestoga Cir
- 115 Hitching Post Rd
- 70 Hitching Post Rd
- 114 Hitching Post Rd
- 67 Hitching Post Rd
- 4695 Conestoga Cir
- 65 Hitching Post Rd