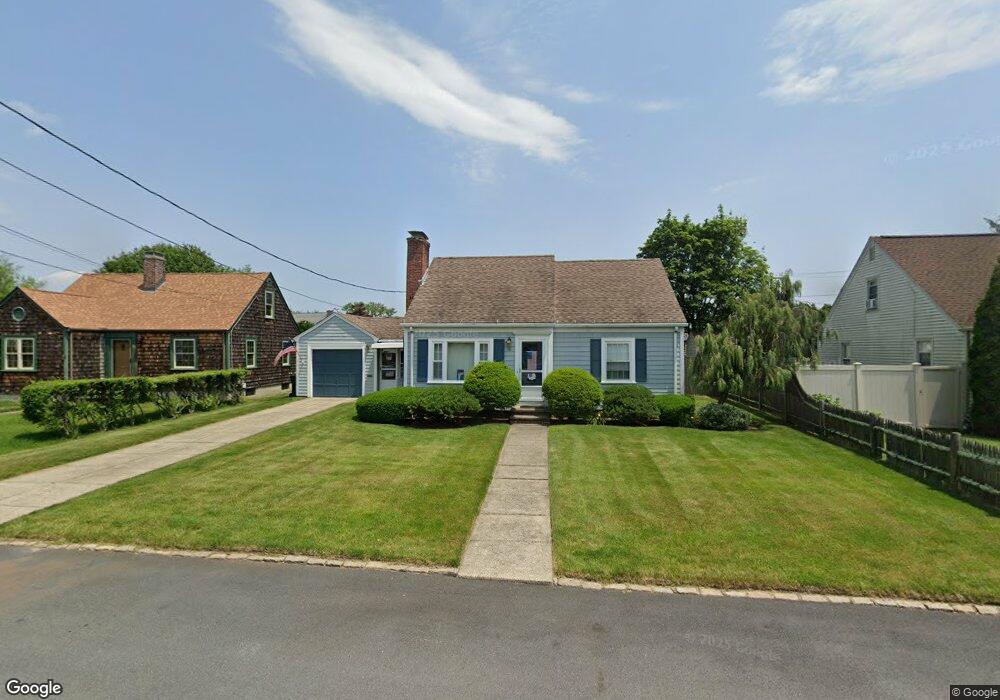
78 Kenyon Rd Cranston, RI 02910
Eden Park NeighborhoodEstimated Value: $389,000 - $414,000
4
Beds
1
Bath
1,550
Sq Ft
$259/Sq Ft
Est. Value
About This Home
This home is located at 78 Kenyon Rd, Cranston, RI 02910 and is currently estimated at $401,707, approximately $259 per square foot. 78 Kenyon Rd is a home located in Providence County with nearby schools including Park View Middle School, Cranston High School East, and Cadence Academy Preschool - Cranston.
Ownership History
Date
Name
Owned For
Owner Type
Purchase Details
Closed on
Jul 31, 1997
Sold by
Lacroix Lynanne M
Bought by
Correra Jane A
Current Estimated Value
Home Financials for this Owner
Home Financials are based on the most recent Mortgage that was taken out on this home.
Original Mortgage
$99,900
Interest Rate
7.55%
Purchase Details
Closed on
Apr 24, 1992
Sold by
Gentile Joseph
Bought by
Lacroixu Joseph A
Create a Home Valuation Report for This Property
The Home Valuation Report is an in-depth analysis detailing your home's value as well as a comparison with similar homes in the area
Home Values in the Area
Average Home Value in this Area
Purchase History
| Date | Buyer | Sale Price | Title Company |
|---|---|---|---|
| Correra Jane A | $111,000 | -- | |
| Lacroixu Joseph A | $124,500 | -- |
Source: Public Records
Mortgage History
| Date | Status | Borrower | Loan Amount |
|---|---|---|---|
| Open | Lacroixu Joseph A | $25,000 | |
| Open | Lacroixu Joseph A | $107,000 | |
| Closed | Lacroixu Joseph A | $95,000 | |
| Closed | Lacroixu Joseph A | $99,900 |
Source: Public Records
Tax History
| Year | Tax Paid | Tax Assessment Tax Assessment Total Assessment is a certain percentage of the fair market value that is determined by local assessors to be the total taxable value of land and additions on the property. | Land | Improvement |
|---|---|---|---|---|
| 2025 | $4,428 | $319,000 | $110,500 | $208,500 |
| 2024 | $4,279 | $314,400 | $110,500 | $203,900 |
| 2023 | $4,421 | $233,900 | $72,800 | $161,100 |
| 2022 | $4,329 | $233,900 | $72,800 | $161,100 |
| 2021 | $4,210 | $233,900 | $72,800 | $161,100 |
| 2020 | $3,990 | $192,100 | $69,300 | $122,800 |
| 2019 | $3,990 | $192,100 | $69,300 | $122,800 |
| 2018 | $3,898 | $192,100 | $69,300 | $122,800 |
| 2017 | $3,790 | $165,200 | $62,400 | $102,800 |
| 2016 | $3,709 | $165,200 | $62,400 | $102,800 |
| 2015 | $3,709 | $165,200 | $62,400 | $102,800 |
| 2014 | $3,650 | $159,800 | $62,400 | $97,400 |
Source: Public Records
Map
Nearby Homes
Your Personal Tour Guide
Ask me questions while you tour the home.