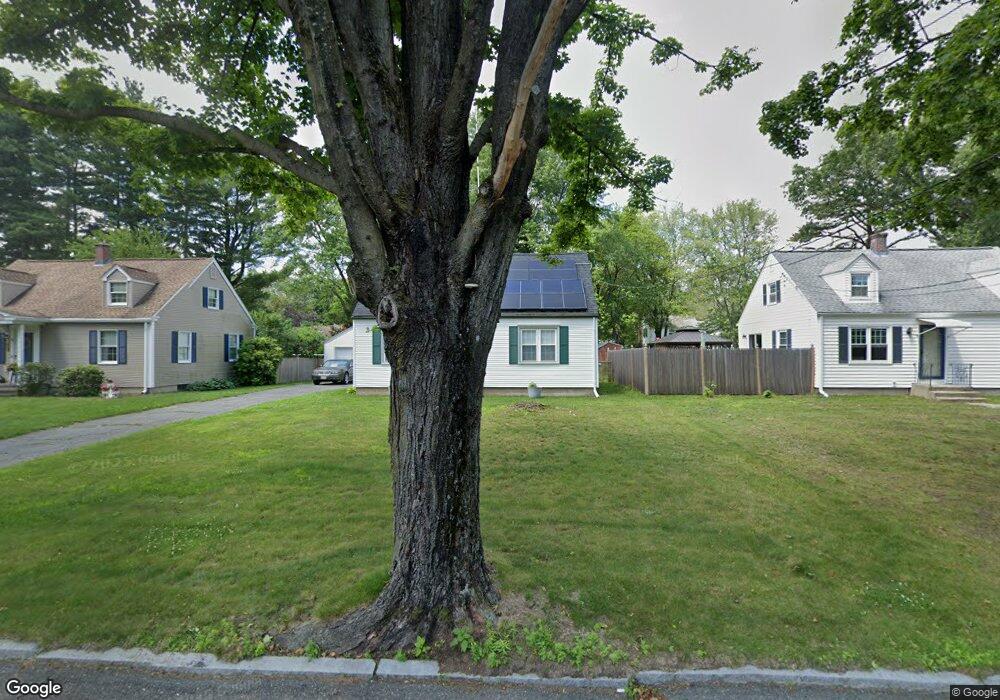
78 Lumae St Springfield, MA 01119
Sixteen Acres NeighborhoodEstimated Value: $298,816 - $350,000
2
Beds
2
Baths
1,344
Sq Ft
$244/Sq Ft
Est. Value
About This Home
This home is located at 78 Lumae St, Springfield, MA 01119 and is currently estimated at $327,454, approximately $243 per square foot. 78 Lumae St is a home located in Hampden County with nearby schools including Glickman Elementary, John J Duggan Middle, and Springfield High School of Science and Technology.
Ownership History
Date
Name
Owned For
Owner Type
Purchase Details
Closed on
Sep 20, 2002
Sold by
Peterson James A and Peterson Michelle F
Bought by
Boyd Gary G
Current Estimated Value
Home Financials for this Owner
Home Financials are based on the most recent Mortgage that was taken out on this home.
Original Mortgage
$140,750
Outstanding Balance
$59,311
Interest Rate
6.36%
Mortgage Type
Purchase Money Mortgage
Estimated Equity
$268,143
Purchase Details
Closed on
Dec 1, 1998
Sold by
Peterson James A and Peterson Mary A
Bought by
Peterson James A and Peterson Michelle F
Home Financials for this Owner
Home Financials are based on the most recent Mortgage that was taken out on this home.
Original Mortgage
$80,300
Interest Rate
6.83%
Mortgage Type
Purchase Money Mortgage
Create a Home Valuation Report for This Property
The Home Valuation Report is an in-depth analysis detailing your home's value as well as a comparison with similar homes in the area
Home Values in the Area
Average Home Value in this Area
Purchase History
| Date | Buyer | Sale Price | Title Company |
|---|---|---|---|
| Boyd Gary G | $138,000 | -- | |
| Peterson James A | $78,000 | -- |
Source: Public Records
Mortgage History
| Date | Status | Borrower | Loan Amount |
|---|---|---|---|
| Open | Peterson James A | $140,750 | |
| Previous Owner | Peterson James A | $45,000 | |
| Previous Owner | Peterson James A | $80,300 | |
| Previous Owner | Peterson James A | $20,000 |
Source: Public Records
Tax History
| Year | Tax Paid | Tax Assessment Tax Assessment Total Assessment is a certain percentage of the fair market value that is determined by local assessors to be the total taxable value of land and additions on the property. | Land | Improvement |
|---|---|---|---|---|
| 2025 | $3,730 | $237,900 | $51,400 | $186,500 |
| 2024 | $3,811 | $237,300 | $51,400 | $185,900 |
| 2023 | $3,229 | $189,400 | $49,000 | $140,400 |
| 2022 | $3,378 | $179,500 | $49,000 | $130,500 |
| 2021 | $3,151 | $166,700 | $44,500 | $122,200 |
| 2020 | $3,170 | $162,300 | $44,500 | $117,800 |
| 2019 | $3,092 | $157,100 | $44,500 | $112,600 |
| 2018 | $3,011 | $153,000 | $44,500 | $108,500 |
| 2017 | $2,921 | $148,600 | $44,000 | $104,600 |
| 2016 | $2,780 | $141,400 | $44,000 | $97,400 |
| 2015 | $2,809 | $142,800 | $44,000 | $98,800 |
Source: Public Records
Map
Nearby Homes
- Lot 37 Kane St
- 186 Bolton St
- 235 Starling Rd
- 39 Groton St
- 53 Pidgeon Dr
- 38 Northway Dr
- 121 Mallowhill Rd
- 244 Nassau Dr Unit 244
- 25 Nassau Dr Unit 25
- 72 Nassau Dr
- 173 Nassau Dr
- 88 Senator St
- 854 Grayson Dr
- 367 Nassau Dr Unit 367
- 15 Kingoke Ln
- 47 Ravenwood St
- 56 Rosemary Dr
- 130 Spear Rd
- 19 Annies Way
- 56 Contessa Ln
Your Personal Tour Guide
Ask me questions while you tour the home.