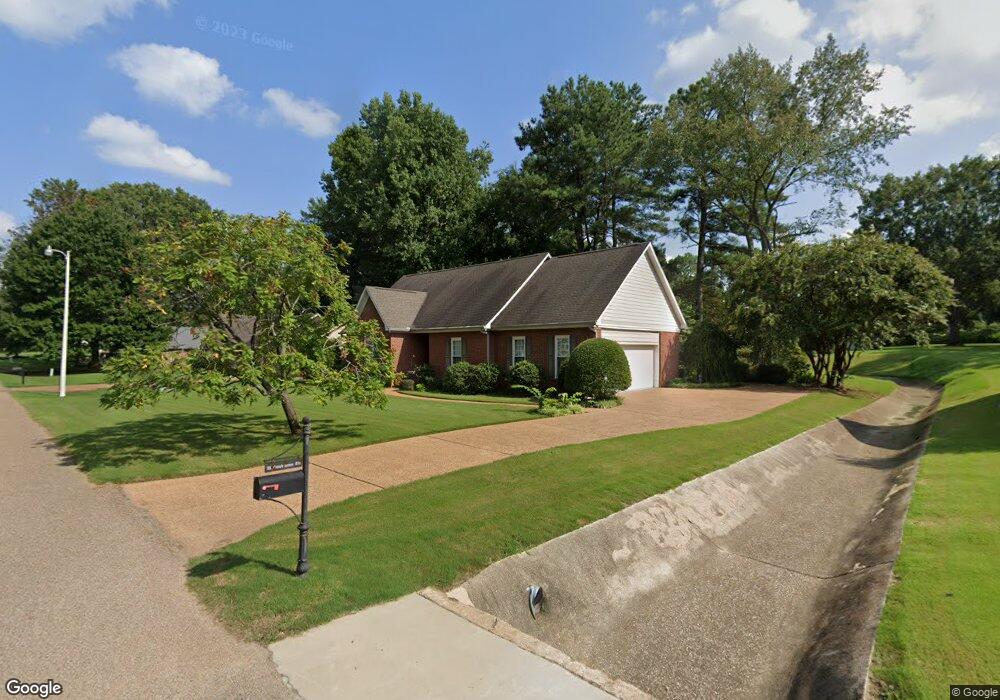
78 Sunhaven Dr Jackson, TN 38305
Estimated Value: $245,000 - $284,000
--
Bed
2
Baths
1,853
Sq Ft
$140/Sq Ft
Est. Value
About This Home
This home is located at 78 Sunhaven Dr, Jackson, TN 38305 and is currently estimated at $259,382, approximately $139 per square foot. 78 Sunhaven Dr is a home located in Madison County with nearby schools including Thelma Barker Elementary School, Northeast Middle School, and North Side High School.
Ownership History
Date
Name
Owned For
Owner Type
Purchase Details
Closed on
Jun 28, 2024
Sold by
Flatt Fesmire Alethea Jayne and Flatt David Fesmire
Bought by
Litteral Blake D and Litteral Mckenzie M
Current Estimated Value
Home Financials for this Owner
Home Financials are based on the most recent Mortgage that was taken out on this home.
Original Mortgage
$255,290
Outstanding Balance
$252,258
Interest Rate
7.02%
Mortgage Type
FHA
Estimated Equity
$7,124
Purchase Details
Closed on
Mar 4, 1997
Sold by
Paul Wade M
Bought by
Wayne Fesmire C
Purchase Details
Closed on
Feb 28, 1997
Sold by
Paul Wade M
Bought by
Wayne Fesmire C and Wayne Althea J
Purchase Details
Closed on
Aug 17, 1995
Bought by
Paul Wade
Purchase Details
Closed on
Oct 24, 1991
Bought by
Rhodes Charles
Purchase Details
Closed on
Feb 4, 1988
Bought by
Matlock Montie
Create a Home Valuation Report for This Property
The Home Valuation Report is an in-depth analysis detailing your home's value as well as a comparison with similar homes in the area
Home Values in the Area
Average Home Value in this Area
Purchase History
| Date | Buyer | Sale Price | Title Company |
|---|---|---|---|
| Litteral Blake D | $260,000 | None Listed On Document | |
| Wayne Fesmire C | $126,500 | -- | |
| Wayne Fesmire C | $126,500 | -- | |
| Paul Wade | $118,500 | -- | |
| Rhodes Charles | $10,000 | -- | |
| Matlock Montie | -- | -- |
Source: Public Records
Mortgage History
| Date | Status | Borrower | Loan Amount |
|---|---|---|---|
| Open | Litteral Blake D | $255,290 |
Source: Public Records
Tax History Compared to Growth
Tax History
| Year | Tax Paid | Tax Assessment Tax Assessment Total Assessment is a certain percentage of the fair market value that is determined by local assessors to be the total taxable value of land and additions on the property. | Land | Improvement |
|---|---|---|---|---|
| 2024 | $806 | $43,000 | $8,750 | $34,250 |
| 2022 | $1,499 | $43,000 | $8,750 | $34,250 |
| 2021 | $1,394 | $32,325 | $6,500 | $25,825 |
| 2020 | $1,394 | $32,325 | $6,500 | $25,825 |
| 2019 | $1,394 | $32,325 | $6,500 | $25,825 |
| 2018 | $1,394 | $32,325 | $6,500 | $25,825 |
| 2017 | $1,389 | $31,475 | $6,500 | $24,975 |
| 2016 | $1,295 | $31,475 | $6,500 | $24,975 |
| 2015 | $1,294 | $31,475 | $6,500 | $24,975 |
| 2014 | $1,294 | $31,475 | $6,500 | $24,975 |
Source: Public Records
Map
Nearby Homes
- 48 Sunhaven Dr
- 29 Leigh Ln
- 160 Plantation Rd
- 260 Stonehaven Cove
- 21 Ravens Rest
- 33 Bradmere Cove
- 20 Branson Place
- 116 Chickering Rd
- 22 Southwind Dr Unit 22
- 34 Castle Pines Dr
- 90 Steeplechase Dr
- 8 Calumet Dr
- 68 Windemere Cir
- 10 Richstone Cove
- 222 Country Club Ln
- 58 Country Club Cove
- 11 Wyndhurst Dr
- 45 Countrywood Dr
- 27 Mill Creek Cove
- 55 Brookstone Place
- 72 Sunhaven Dr
- 86 Sunhaven Dr
- 123 Stonehaven Dr
- 64 Sunhaven Dr
- 94 Sunhaven Dr
- 79 Sunhaven Dr
- 73 Sunhaven Dr
- 65 Sunhaven Dr
- 109 Stonehaven Dr
- 56 Sunhaven Dr
- 114 Sunhaven Dr
- 114 Stonehaven Dr
- 192 Stonehaven Dr
- 57 Sunhaven Dr
- 191 Stonehaven Dr
- 115 Sunhaven Dr
- 122 Sunhaven Dr
- 29 Glen Eagle Cove
- 6 Ohara Ln
- 49 Sunhaven Dr