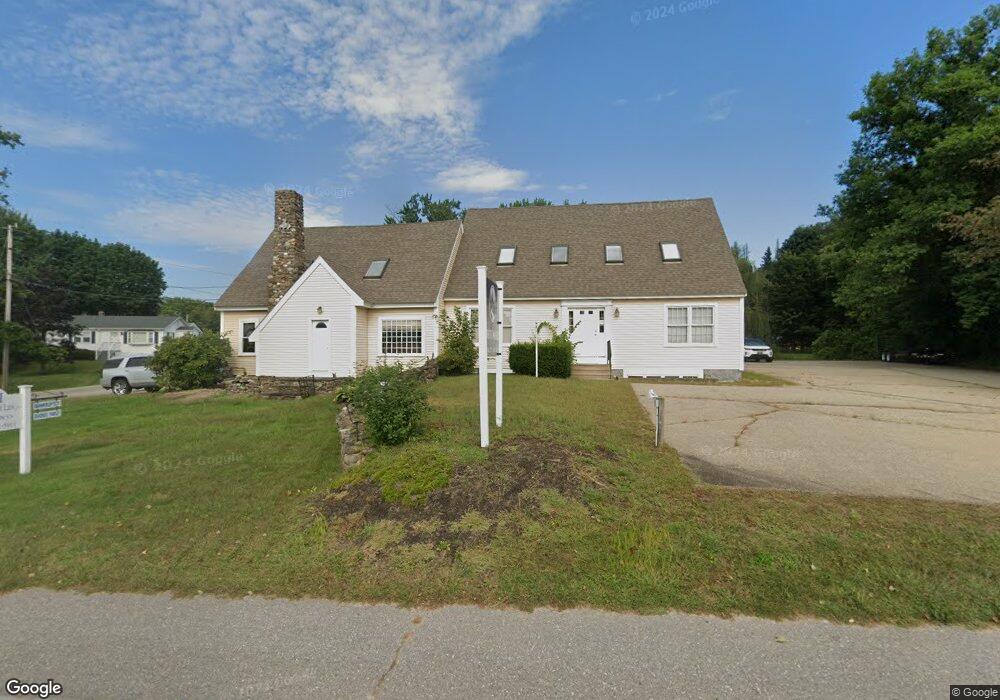
780 Central St Franklin, NH 03235
Studio
--
Bath
4,597
Sq Ft
17,424
Sq Ft
About This Home
This home is located at 780 Central St, Franklin, NH 03235. 780 Central St is a home located in Merrimack County with nearby schools including Paul A. Smith School, Franklin Middle School, and Franklin High School.
Ownership History
Date
Name
Owned For
Owner Type
Purchase Details
Closed on
Apr 27, 2023
Sold by
Jan C & Jan W Rlty Hldg L
Bought by
Cvr9395 Llc
Home Financials for this Owner
Home Financials are based on the most recent Mortgage that was taken out on this home.
Original Mortgage
$697,558
Outstanding Balance
$675,247
Interest Rate
6.6%
Mortgage Type
Commercial
Purchase Details
Closed on
Dec 3, 2008
Sold by
Jan C & Jan W Realty Hld
Bought by
Jan C & Jan W Realty H
Home Financials for this Owner
Home Financials are based on the most recent Mortgage that was taken out on this home.
Original Mortgage
$230,000
Interest Rate
6.11%
Mortgage Type
Commercial
Purchase Details
Closed on
Jun 23, 2005
Sold by
Darbyshire Paul M
Bought by
Jan C Realty and Jan W Realty
Home Financials for this Owner
Home Financials are based on the most recent Mortgage that was taken out on this home.
Original Mortgage
$188,000
Interest Rate
5.82%
Mortgage Type
Commercial
Create a Home Valuation Report for This Property
The Home Valuation Report is an in-depth analysis detailing your home's value as well as a comparison with similar homes in the area
Home Values in the Area
Average Home Value in this Area
Purchase History
| Date | Buyer | Sale Price | Title Company |
|---|---|---|---|
| Cvr9395 Llc | $599,933 | None Available | |
| Jan C & Jan W Realty H | $115,000 | -- | |
| Jan C Realty | $235,000 | -- |
Source: Public Records
Mortgage History
| Date | Status | Borrower | Loan Amount |
|---|---|---|---|
| Open | Cvr9395 Llc | $697,558 | |
| Previous Owner | Jan C Realty | $230,000 | |
| Previous Owner | Jan C Realty | $188,000 |
Source: Public Records
Tax History
| Year | Tax Paid | Tax Assessment Tax Assessment Total Assessment is a certain percentage of the fair market value that is determined by local assessors to be the total taxable value of land and additions on the property. | Land | Improvement |
|---|---|---|---|---|
| 2025 | $8,092 | $459,000 | $114,600 | $344,400 |
| 2024 | $7,872 | $459,000 | $114,600 | $344,400 |
| 2023 | $7,463 | $459,000 | $114,600 | $344,400 |
| 2022 | $7,422 | $304,300 | $77,600 | $226,700 |
| 2021 | $7,063 | $304,300 | $77,600 | $226,700 |
| 2020 | $6,950 | $304,300 | $77,600 | $226,700 |
| 2019 | $5,892 | $262,200 | $77,600 | $184,600 |
| 2018 | $5,758 | $262,200 | $77,600 | $184,600 |
| 2017 | $4,961 | $194,100 | $114,000 | $80,100 |
| 2016 | $4,897 | $194,100 | $114,000 | $80,100 |
| 2015 | $3,474 | $139,230 | $80,500 | $58,730 |
| 2011 | $8,059 | $374,500 | $115,000 | $259,500 |
Source: Public Records
Map
Nearby Homes
- 24 Munroe St Unit 1&2
- 225 Kendall St
- 12 Village Way Unit 38
- 18 Highland Ave
- 48 Millstone Dr Unit 58
- 22 Stonehenge Cir Unit 7
- 11 Stonehenge Cir Unit 2
- 15 Millstone Dr Unit 15
- 41 Village Way Unit 22
- 9 Stonehenge Cir Unit 1
- 50 Millstone Dr Unit 57
- 12 Stonehenge Cir
- 14 Stonehenge Cir Unit 11
- Lot 4 Piper St
- 416 Central St
- 88 Franklin St
- 0 Rowell Dr Unit 406 5043422
- 5 Evans Ct
- 69 Cheney St
- 495 W Main St
Your Personal Tour Guide
Ask me questions while you tour the home.