780 Primrose Ln Nipomo, CA 93444
Estimated Value: $782,000 - $943,000
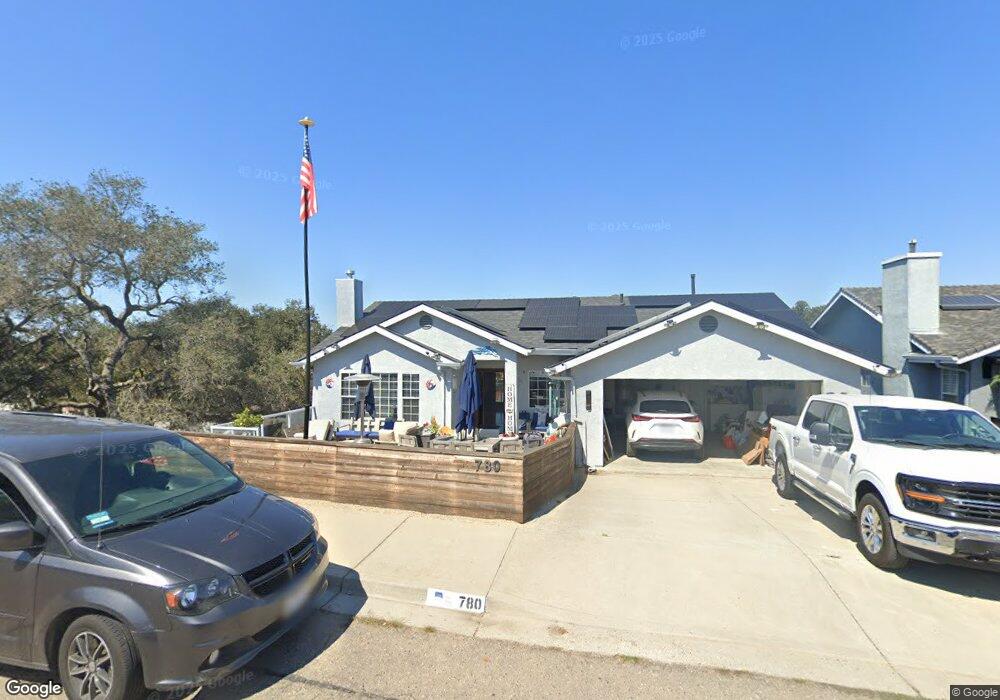
About This Home
This home is located at 780 Primrose Ln, Nipomo, CA 93444 and is currently estimated at $855,426, approximately $469 per square foot. 780 Primrose Ln is a home located in San Luis Obispo County with nearby schools including Dana Elementary School, Mesa Middle School, and Nipomo High School.
Ownership History
We collect this data history from publicly available records. To have your information removed, we recommend requesting removal directly through your county’s website.
Purchase Details
Purchase Details
Home Financials for this Owner
Home Financials are based on the most recent Mortgage that was taken out on this home.Purchase Details
Home Financials for this Owner
Home Financials are based on the most recent Mortgage that was taken out on this home.Home Values in the Area
Average Home Value in this Area
Purchase History
We collect this data history from publicly available records. To have your information removed, we recommend requesting removal directly through your county’s website.
| Date | Buyer | Sale Price | Title Company |
|---|---|---|---|
| -- | None Available | ||
| $213,000 | Chicago Title Co | ||
| $193,000 | Chicago Title Co |
Mortgage History
We collect this data history from publicly available records. To have your information removed, we recommend requesting removal directly through your county’s website.
| Date | Status | Borrower | Loan Amount |
|---|---|---|---|
| Previous Owner | $170,400 | ||
| Previous Owner | $196,860 |
Tax History
We collect this data history from publicly available records. To have your information removed, we recommend requesting removal directly through your county’s website.
| Year | Tax Paid | Tax Assessment Tax Assessment Total Assessment is a certain percentage of the fair market value that is determined by local assessors to be the total taxable value of land and additions on the property. | Land | Improvement |
|---|---|---|---|---|
| 2025 | $3,294 | $327,353 | $107,577 | $219,776 |
| 2024 | $3,254 | $320,935 | $105,468 | $215,467 |
| 2023 | $3,254 | $314,643 | $103,400 | $211,243 |
| 2022 | $3,204 | $308,474 | $101,373 | $207,101 |
| 2021 | $3,197 | $302,427 | $99,386 | $203,041 |
| 2020 | $3,159 | $299,327 | $98,367 | $200,960 |
| 2019 | $3,138 | $293,459 | $96,439 | $197,020 |
| 2018 | $3,100 | $287,706 | $94,549 | $193,157 |
| 2017 | $3,040 | $282,066 | $92,696 | $189,370 |
| 2016 | $2,866 | $276,536 | $90,879 | $185,657 |
| 2015 | $2,823 | $272,383 | $89,514 | $182,869 |
| 2014 | $2,717 | $267,048 | $87,761 | $179,287 |
Map
- 778 Primrose Ln
- 187 Amaranth Ln
- 719 W Tefft St
- 775 W Tefft St
- 228 Chaparral Ln
- 680 Hill St
- 181 Jerome Ct
- 236 Scarlett Cir
- 549 Hill St
- 160 San Antonio Ln
- 448 Pomeroy Rd
- 180 Cyclone St
- 397 Nopal Way
- 449 W Tefft St Unit 5
- 449 W Tefft St Unit 41
- 545 Grande St
- 370 Avenida de Amigos
- 525 Grande Ave
- 0 W St Unit SC26102413
- 0 W Price Sparks St Unit SC26102388
- 777 Viola Ct
- 779 Primrose Ln
- 773 Primrose Ln
- 145 Gardenia Way
- 776 Viola Ct
- 139 Gardenia Way
- 770 Viola Ct
- 785 Primrose Ln
- 767 Primrose Ln
- 765 Viola Ct
- 133 Gardenia Way
- 0 Gardenia Way Unit LOT
- 759 Viola Ct
- 766 Viola Ct
- 129 Gardenia Way
- 780 W Tefft St
- 761 Primrose Ln Unit LOT
- 761 Primrose Ln
- 760 Viola Ct
- 130 Pino Solo Ct
Ask me questions while you tour the home.