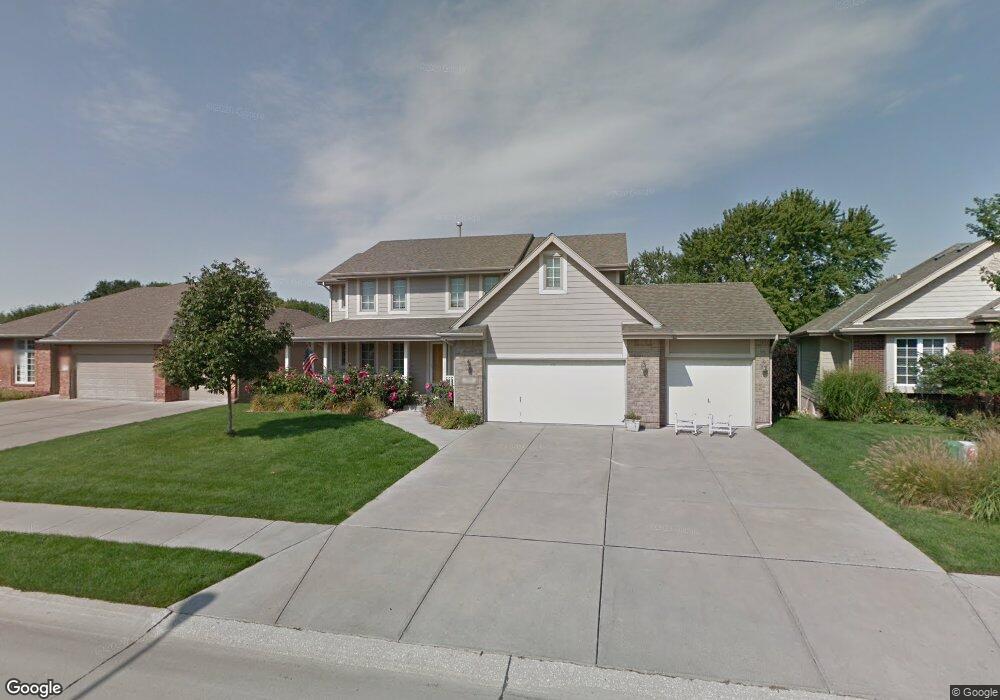
7808 S 171st St Omaha, NE 68136
Southwest Omaha NeighborhoodEstimated Value: $427,204 - $483,000
4
Beds
4
Baths
2,295
Sq Ft
$201/Sq Ft
Est. Value
About This Home
This home is located at 7808 S 171st St, Omaha, NE 68136 and is currently estimated at $462,301, approximately $201 per square foot. 7808 S 171st St is a home located in Sarpy County with nearby schools including Palisades Elementary School, Gretna Middle School, and Gretna High School.
Ownership History
Date
Name
Owned For
Owner Type
Purchase Details
Closed on
Apr 23, 2024
Sold by
Galvan Leanne and Robey Leanne
Bought by
Galvan Leanne and Galvan Christopher
Current Estimated Value
Purchase Details
Closed on
Oct 23, 2007
Sold by
Robey Robert V and Robey Leanne
Bought by
Robey Leanne
Purchase Details
Closed on
Jan 9, 2004
Sold by
Rockland Homes Inc
Bought by
Robey Robert V and Robey Leanne
Home Financials for this Owner
Home Financials are based on the most recent Mortgage that was taken out on this home.
Original Mortgage
$234,439
Interest Rate
5.57%
Purchase Details
Closed on
Jan 7, 2003
Sold by
Rst Development Llc
Bought by
Rockland Homes Inc
Home Financials for this Owner
Home Financials are based on the most recent Mortgage that was taken out on this home.
Original Mortgage
$176,100
Interest Rate
5.9%
Mortgage Type
Small Business Administration
Create a Home Valuation Report for This Property
The Home Valuation Report is an in-depth analysis detailing your home's value as well as a comparison with similar homes in the area
Home Values in the Area
Average Home Value in this Area
Purchase History
| Date | Buyer | Sale Price | Title Company |
|---|---|---|---|
| Galvan Leanne | -- | None Listed On Document | |
| Robey Leanne | -- | None Available | |
| Robey Robert V | $227,000 | Allegiance Title | |
| Rockland Homes Inc | $37,000 | -- |
Source: Public Records
Mortgage History
| Date | Status | Borrower | Loan Amount |
|---|---|---|---|
| Previous Owner | Robey Robert V | $234,439 | |
| Previous Owner | Rockland Homes Inc | $176,100 |
Source: Public Records
Tax History Compared to Growth
Tax History
| Year | Tax Paid | Tax Assessment Tax Assessment Total Assessment is a certain percentage of the fair market value that is determined by local assessors to be the total taxable value of land and additions on the property. | Land | Improvement |
|---|---|---|---|---|
| 2025 | $7,887 | $403,800 | $67,000 | $336,800 |
| 2024 | $9,228 | $388,691 | $66,000 | $322,691 |
| 2023 | $9,228 | $382,774 | $58,000 | $324,774 |
| 2022 | $8,275 | $333,692 | $54,000 | $279,692 |
| 2021 | $7,403 | $299,446 | $52,000 | $247,446 |
| 2020 | $7,094 | $287,090 | $47,000 | $240,090 |
| 2019 | $7,175 | $279,649 | $47,000 | $232,649 |
| 2018 | $6,921 | $265,850 | $42,000 | $223,850 |
| 2017 | $6,146 | $237,504 | $37,000 | $200,504 |
| 2016 | $6,167 | $239,276 | $37,000 | $202,276 |
| 2015 | $6,103 | $229,252 | $37,000 | $192,252 |
| 2014 | $5,951 | $225,924 | $37,000 | $188,924 |
| 2012 | -- | $221,465 | $37,000 | $184,465 |
Source: Public Records
Map
Nearby Homes
- 7705 S 169th St
- 16904 Joanne Dr
- 7404 S 169th St
- 7501 S 170th St
- 7810 S 166th St
- 16641 Olive St
- 7820 S 173rd St
- 16528 Briar St
- 16521 Redwood St
- 7216 S 170th St
- 16603 Edna St
- 7501 S 166th St
- 7437 S 176th St
- 7011 S 167th Ave
- 17511 Greenleaf St
- 17514 Robin Dr
- 8364 S 176th Ave
- 17523 Greenleaf St
- 17429 Edna Cir
- 17522 Robin Dr
- 7804 S 171st St
- 7816 S 171st St
- 17022 Willow St
- 7817 S 171st St
- 7813 S 171st St
- 7932 S 171st St
- 17018 Willow St
- 7821 S 171st St
- 17017 Willow St
- 7936 S 171st St
- 17014 Willow St
- 17013 Willow St
- 17006 Cottonwood Cir
- 17006 Cottonwood Cr
- 7935 S 171st St
- 7940 S 171st St
- 7806 S 169th St
- 7802 S 169th St
- 16905 Willow St
- 16910 Willow St