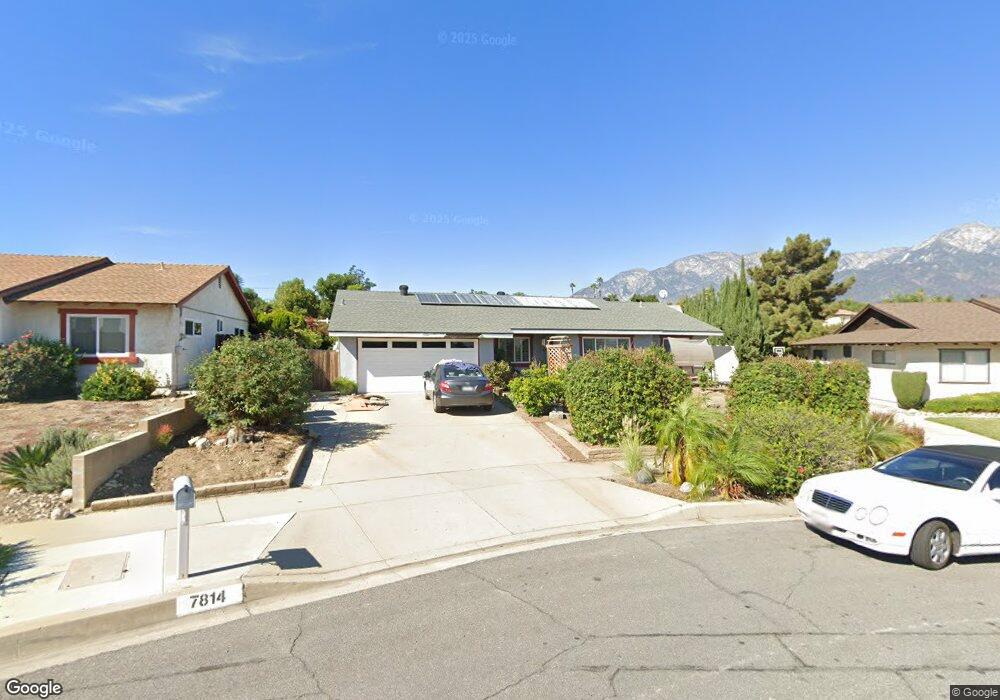
7814 Hickory Cir Rancho Cucamonga, CA 91730
Estimated Value: $658,493 - $716,000
3
Beds
2
Baths
1,244
Sq Ft
$558/Sq Ft
Est. Value
About This Home
This home is located at 7814 Hickory Cir, Rancho Cucamonga, CA 91730 and is currently estimated at $694,623, approximately $558 per square foot. 7814 Hickory Cir is a home located in San Bernardino County with nearby schools including Valle Vista Elementary, Cucamonga Middle, and Alta Loma High.
Ownership History
Date
Name
Owned For
Owner Type
Purchase Details
Closed on
Jan 28, 2016
Sold by
Moody Kimberly R and Moody Kimberly R
Bought by
Moody Kimberly R
Current Estimated Value
Home Financials for this Owner
Home Financials are based on the most recent Mortgage that was taken out on this home.
Original Mortgage
$201,500
Outstanding Balance
$124,324
Interest Rate
3.93%
Mortgage Type
New Conventional
Estimated Equity
$570,299
Purchase Details
Closed on
Jul 25, 2007
Sold by
Moody William B
Bought by
Moody Kimberly R
Home Financials for this Owner
Home Financials are based on the most recent Mortgage that was taken out on this home.
Original Mortgage
$205,000
Interest Rate
6.73%
Mortgage Type
New Conventional
Purchase Details
Closed on
Jun 19, 1995
Sold by
Transamerica Financial Services/5517
Bought by
Moody William B and Moody Kimberly R
Home Financials for this Owner
Home Financials are based on the most recent Mortgage that was taken out on this home.
Original Mortgage
$123,211
Interest Rate
7.88%
Mortgage Type
FHA
Purchase Details
Closed on
Feb 27, 1995
Sold by
Iversen Douglas
Bought by
Transamerica Financial Services
Create a Home Valuation Report for This Property
The Home Valuation Report is an in-depth analysis detailing your home's value as well as a comparison with similar homes in the area
Home Values in the Area
Average Home Value in this Area
Purchase History
| Date | Buyer | Sale Price | Title Company |
|---|---|---|---|
| Moody Kimberly R | -- | Wfg Title Company Of Ca | |
| Moody Kimberly R | -- | Stewart Title Of California | |
| Moody William B | $124,500 | First American Title Co | |
| Transamerica Financial Services | $100,700 | -- |
Source: Public Records
Mortgage History
| Date | Status | Borrower | Loan Amount |
|---|---|---|---|
| Open | Moody Kimberly R | $201,500 | |
| Closed | Moody Kimberly R | $205,000 | |
| Closed | Moody William B | $123,211 |
Source: Public Records
Tax History Compared to Growth
Tax History
| Year | Tax Paid | Tax Assessment Tax Assessment Total Assessment is a certain percentage of the fair market value that is determined by local assessors to be the total taxable value of land and additions on the property. | Land | Improvement |
|---|---|---|---|---|
| 2025 | $2,302 | $209,126 | $68,870 | $140,256 |
| 2024 | $2,302 | $205,026 | $67,520 | $137,506 |
| 2023 | $2,253 | $201,006 | $66,196 | $134,810 |
| 2022 | $2,217 | $197,065 | $64,898 | $132,167 |
| 2021 | $2,216 | $193,200 | $63,625 | $129,575 |
| 2020 | $3,487 | $191,219 | $62,973 | $128,246 |
| 2019 | $3,476 | $187,469 | $61,738 | $125,731 |
| 2018 | $3,708 | $183,793 | $60,527 | $123,266 |
| 2017 | $3,631 | $180,189 | $59,340 | $120,849 |
| 2016 | $3,577 | $176,655 | $58,176 | $118,479 |
| 2015 | $2,002 | $174,001 | $57,302 | $116,699 |
| 2014 | $1,945 | $170,593 | $56,180 | $114,413 |
Source: Public Records
Map
Nearby Homes
- 7719 Vineyard Ave
- 0 Camino Predera Unit OC25188933
- 0 Camino Predera Unit WS25184133
- 8976 Yew St
- 8091 Camino Predera
- 7906 Montara Ave
- 8167 Vineyard Ave Unit 23
- 8167 Vineyard Ave Unit 38
- 8167 Vineyard Ave Unit 109
- 8651 Foothill Blvd Unit 63
- 8651 Foothill Blvd Unit 18
- 8651 Foothill Blvd Unit 46
- 8651 Foothill Blvd Unit 99
- 8651 Foothill Blvd Unit 42
- 7355 Vineyard Ave
- 7730 Layton St
- 9340 Foothill Blvd Unit 68
- 9340 Foothill Blvd Unit 61
- 9340 Foothill Blvd
- 8525 Calle Carabe St Unit 45
- 7820 Hickory Cir
- 7810 Hickory Cir
- 7808 Hickory Cir
- 7830 Hickory Cir
- 7809 Hickory Cir
- 8985 Pecan Ct
- 7804 Hickory Cir
- 8979 Pecan Ct
- 7825 Hickory Cir
- 7838 Hickory Cir
- 7767 Vineyard Ave
- 8993 Pecan Ct
- 8960 Hemlock St
- 7835 Hickory Cir
- 7785 Vineyard Ave
- 7800 Hickory Cir
- 7777 Vineyard Ave
- 8950 Hemlock St
- 8935 Azurite Ave
- 7845 Hickory Cir