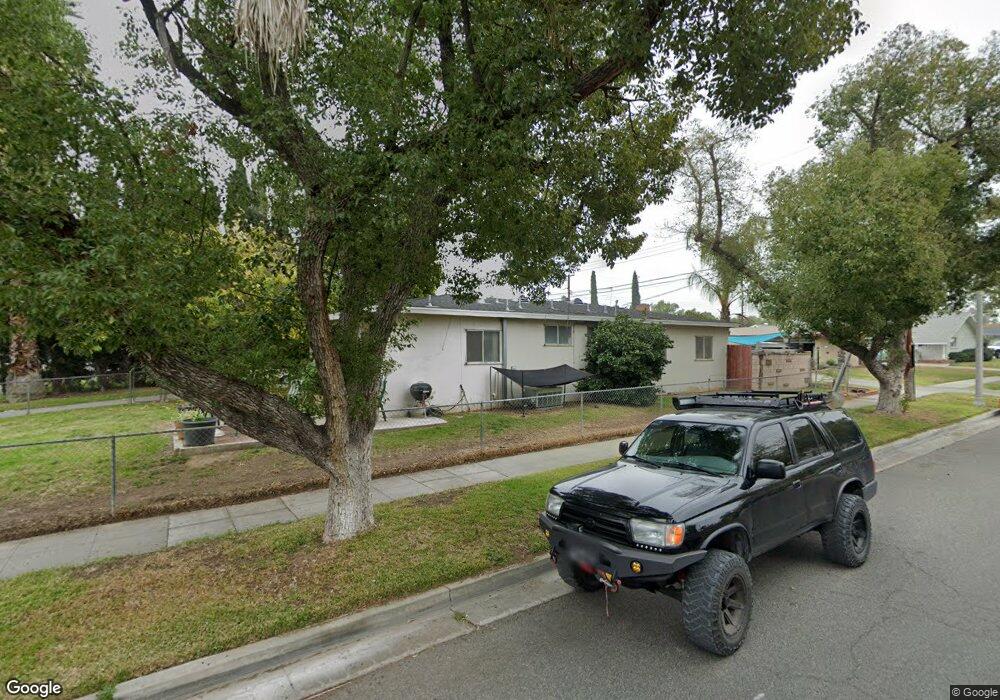
7816 Orchard St Riverside, CA 92504
Ramona NeighborhoodEstimated Value: $538,598 - $587,000
4
Beds
2
Baths
1,250
Sq Ft
$450/Sq Ft
Est. Value
About This Home
This home is located at 7816 Orchard St, Riverside, CA 92504 and is currently estimated at $562,400, approximately $449 per square foot. 7816 Orchard St is a home located in Riverside County with nearby schools including Madison Elementary School, Sierra Middle School, and Ramona High School.
Ownership History
Date
Name
Owned For
Owner Type
Purchase Details
Closed on
Sep 29, 1998
Sold by
Chadwick Allan J
Bought by
Chadwick Tricia L
Current Estimated Value
Home Financials for this Owner
Home Financials are based on the most recent Mortgage that was taken out on this home.
Original Mortgage
$49,094
Outstanding Balance
$10,469
Interest Rate
6.88%
Mortgage Type
FHA
Estimated Equity
$551,931
Purchase Details
Closed on
Sep 17, 1998
Sold by
Hud
Bought by
Chadwick Tricia L
Home Financials for this Owner
Home Financials are based on the most recent Mortgage that was taken out on this home.
Original Mortgage
$49,094
Outstanding Balance
$10,469
Interest Rate
6.88%
Mortgage Type
FHA
Estimated Equity
$551,931
Purchase Details
Closed on
Jun 8, 1998
Sold by
Norwest Mtg Inc
Bought by
Hud
Purchase Details
Closed on
May 8, 1998
Sold by
Acosta Agustin and Acosta Rose M
Bought by
Norwest Mtg Inc
Create a Home Valuation Report for This Property
The Home Valuation Report is an in-depth analysis detailing your home's value as well as a comparison with similar homes in the area
Home Values in the Area
Average Home Value in this Area
Purchase History
| Date | Buyer | Sale Price | Title Company |
|---|---|---|---|
| Chadwick Tricia L | -- | Stewart Title | |
| Chadwick Tricia L | $44,000 | Stewart Title | |
| Hud | -- | Fidelity National Title Ins | |
| Norwest Mtg Inc | $126,680 | Fidelity National Title Ins |
Source: Public Records
Mortgage History
| Date | Status | Borrower | Loan Amount |
|---|---|---|---|
| Open | Chadwick Tricia L | $49,094 |
Source: Public Records
Tax History Compared to Growth
Tax History
| Year | Tax Paid | Tax Assessment Tax Assessment Total Assessment is a certain percentage of the fair market value that is determined by local assessors to be the total taxable value of land and additions on the property. | Land | Improvement |
|---|---|---|---|---|
| 2025 | $1,546 | $137,922 | $54,854 | $83,068 |
| 2023 | $1,546 | $132,569 | $52,725 | $79,844 |
| 2022 | $1,512 | $129,971 | $51,692 | $78,279 |
| 2021 | $1,505 | $127,424 | $50,679 | $76,745 |
| 2020 | $1,494 | $126,119 | $50,160 | $75,959 |
| 2019 | $1,467 | $123,647 | $49,177 | $74,470 |
| 2018 | $1,440 | $121,223 | $48,213 | $73,010 |
| 2017 | $1,415 | $118,847 | $47,268 | $71,579 |
| 2016 | $1,328 | $116,518 | $46,342 | $70,176 |
| 2015 | $1,308 | $114,770 | $45,647 | $69,123 |
| 2014 | $1,296 | $112,523 | $44,753 | $67,770 |
Source: Public Records
Map
Nearby Homes
- 3591 Lillian St
- 7702 Cassia Ave
- 7915 Helena Ave
- 7914 Magnolia Ave
- 3360 Winstrom St
- 7830 Casa Blanca St
- 7994 Magnolia Ave
- 7811 Railroad Ave
- 3765 Roslyn St
- 8084 Magnolia Ave
- 7535 Magnolia Ave
- 7460 Potomac St
- 3551 Brynhurst Dr
- 3890 Rockingham Place
- 3909 Rockingham Place
- 3620 Hoover St
- 7859 Sycamore Ave
- 7614 Fern St
- 7620 Fern St
- 8235 Coleman St