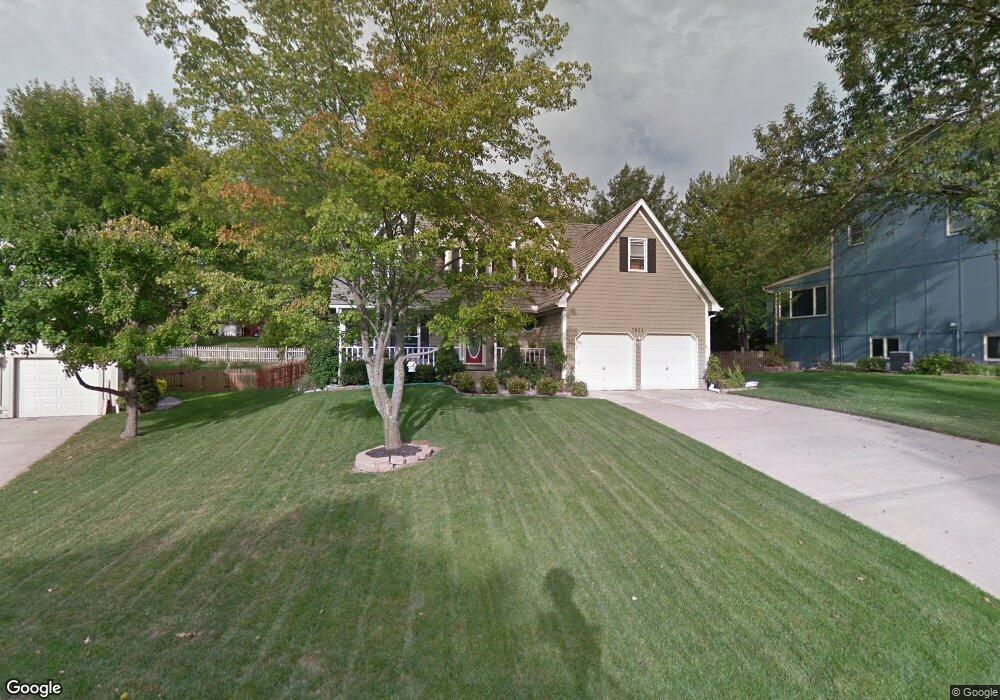
7824 Twilight Ln Shawnee, KS 66217
Estimated Value: $428,450 - $453,000
4
Beds
3
Baths
2,248
Sq Ft
$196/Sq Ft
Est. Value
About This Home
This home is located at 7824 Twilight Ln, Shawnee, KS 66217 and is currently estimated at $441,363, approximately $196 per square foot. 7824 Twilight Ln is a home located in Johnson County with nearby schools including Christa McAuliffe Elementary School, Westridge Middle School, and Shawnee Mission West High School.
Ownership History
Date
Name
Owned For
Owner Type
Purchase Details
Closed on
Jan 17, 2011
Sold by
Peterson Roger E and Peterson Song H
Bought by
Peterson Roger E and Peterson Song H
Current Estimated Value
Home Financials for this Owner
Home Financials are based on the most recent Mortgage that was taken out on this home.
Original Mortgage
$145,000
Outstanding Balance
$4,232
Interest Rate
3.92%
Mortgage Type
New Conventional
Estimated Equity
$437,131
Purchase Details
Closed on
Apr 17, 2003
Sold by
Peterson Roger E
Bought by
Peterson Roger E and Rhyne Song H
Home Financials for this Owner
Home Financials are based on the most recent Mortgage that was taken out on this home.
Original Mortgage
$185,202
Interest Rate
5.64%
Purchase Details
Closed on
Apr 12, 2003
Sold by
Leslie Douglas R and Leslie Nancy L
Bought by
Peterson Roger E
Home Financials for this Owner
Home Financials are based on the most recent Mortgage that was taken out on this home.
Original Mortgage
$185,202
Interest Rate
5.64%
Create a Home Valuation Report for This Property
The Home Valuation Report is an in-depth analysis detailing your home's value as well as a comparison with similar homes in the area
Home Values in the Area
Average Home Value in this Area
Purchase History
| Date | Buyer | Sale Price | Title Company |
|---|---|---|---|
| Peterson Roger E | -- | None Available | |
| Peterson Roger E | -- | Chicago Title Insurance Co | |
| Peterson Roger E | -- | Chicago Title Insurance Co |
Source: Public Records
Mortgage History
| Date | Status | Borrower | Loan Amount |
|---|---|---|---|
| Open | Peterson Roger E | $145,000 | |
| Closed | Peterson Roger E | $185,202 |
Source: Public Records
Tax History Compared to Growth
Tax History
| Year | Tax Paid | Tax Assessment Tax Assessment Total Assessment is a certain percentage of the fair market value that is determined by local assessors to be the total taxable value of land and additions on the property. | Land | Improvement |
|---|---|---|---|---|
| 2024 | $4,945 | $44,700 | $8,650 | $36,050 |
| 2023 | $4,826 | $42,872 | $7,865 | $35,007 |
| 2022 | $4,390 | $38,962 | $7,148 | $31,814 |
| 2021 | $3,974 | $33,442 | $6,500 | $26,942 |
| 2020 | $3,877 | $32,304 | $6,500 | $25,804 |
| 2019 | $3,760 | $31,303 | $5,418 | $25,885 |
| 2018 | $3,623 | $29,889 | $5,418 | $24,471 |
| 2017 | $3,521 | $28,152 | $4,928 | $23,224 |
| 2016 | $3,348 | $26,416 | $4,483 | $21,933 |
| 2015 | $3,183 | $25,277 | $4,483 | $20,794 |
| 2013 | -- | $23,253 | $4,483 | $18,770 |
Source: Public Records
Map
Nearby Homes
- 8033 Hall St
- 15615 W 81st St
- 7621 Lichtenauer Dr
- 15322 W 83rd St
- 7219 Allman Rd
- 7239 Allman Rd
- 7221 Allman Rd
- 7237 Allman Rd
- 7231 Allman Rd
- 15322 W 83rd Terrace
- 15529 W 83rd Terrace
- 14828 W 83rd Place
- 8403 Swarner Dr
- 14915 W 84th Terrace
- 15710 W 84th Terrace
- 7229 Allman Dr
- 7325 Oakview St
- 14620 W 84th St
- 8616 Baska Ct
- 15611 W 86th St
- 7820 Twilight Ln
- 7830 Twilight Ln
- 7823 Twilight Ln
- 7819 Twilight Ln
- 7812 Twilight Ln
- 7827 Twilight Ln
- 7829 Twilight Ln
- 15408 W 79th St
- 7811 Twilight Ln
- 7808 Twilight Ln
- 15311 W 78th Terrace
- 7824 Woodstone Ln
- 7828 Woodstone Ln
- 7804 Twilight Ln
- 15310 W 78th Terrace
- 7832 Woodstone Ln
- 15305 W 78th Terrace
- 7901 Hall St
- 7803 Twilight Ln
- 15408 W 79th Terrace