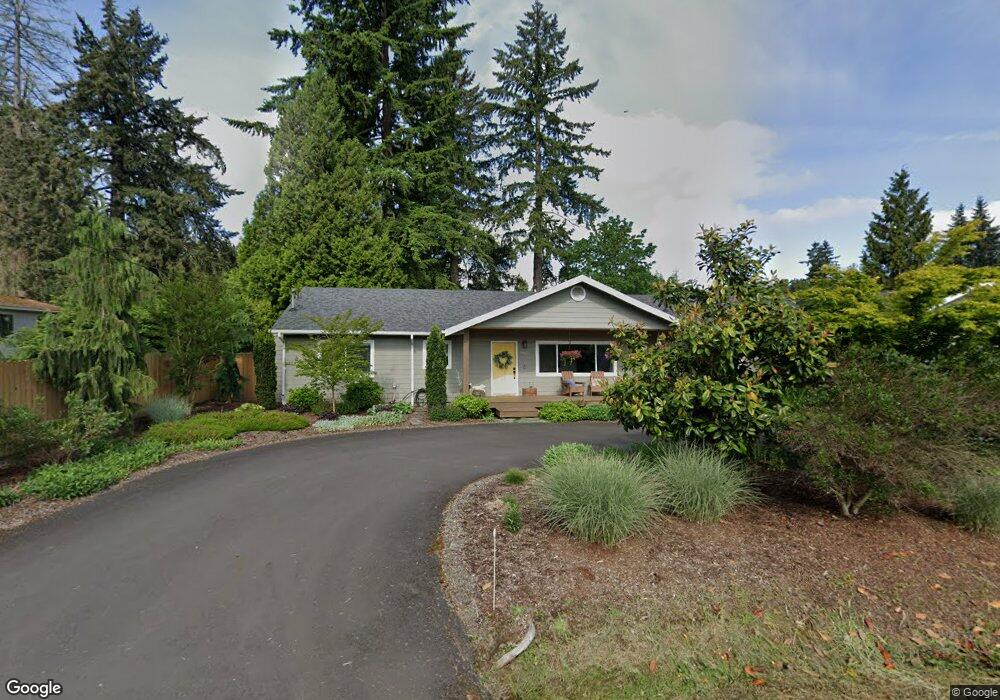
7825 SE 257th Ave Gresham, OR 97080
Sandy River NeighborhoodEstimated Value: $652,000 - $762,289
4
Beds
3
Baths
3,136
Sq Ft
$225/Sq Ft
Est. Value
About This Home
This home is located at 7825 SE 257th Ave, Gresham, OR 97080 and is currently estimated at $707,145, approximately $225 per square foot. 7825 SE 257th Ave is a home located in Multnomah County with nearby schools including Hogan Cedars Elementary School, Dexter McCarty Middle School, and Sam Barlow High School.
Ownership History
Date
Name
Owned For
Owner Type
Purchase Details
Closed on
Jun 30, 2015
Sold by
Fujimoto Ryan T and Fujimoto Beth Ann
Bought by
Freshour Jacob and Freshour Jessica M
Current Estimated Value
Home Financials for this Owner
Home Financials are based on the most recent Mortgage that was taken out on this home.
Original Mortgage
$300,000
Outstanding Balance
$232,194
Interest Rate
3.81%
Mortgage Type
VA
Estimated Equity
$474,951
Purchase Details
Closed on
Aug 5, 2011
Sold by
Byerley James G
Bought by
Fujimoto Ryan T and Fujimoto Beth Ann
Home Financials for this Owner
Home Financials are based on the most recent Mortgage that was taken out on this home.
Original Mortgage
$308,000
Interest Rate
4.46%
Mortgage Type
New Conventional
Purchase Details
Closed on
Oct 16, 2001
Sold by
Mulcahy Dennis M
Bought by
Byerley James G and Byerley Pamela A
Home Financials for this Owner
Home Financials are based on the most recent Mortgage that was taken out on this home.
Original Mortgage
$160,050
Interest Rate
6.88%
Create a Home Valuation Report for This Property
The Home Valuation Report is an in-depth analysis detailing your home's value as well as a comparison with similar homes in the area
Home Values in the Area
Average Home Value in this Area
Purchase History
| Date | Buyer | Sale Price | Title Company |
|---|---|---|---|
| Freshour Jacob | $432,500 | First American | |
| Fujimoto Ryan T | $385,000 | First Amer Title Ins Co Or | |
| Byerley James G | $165,000 | Oregon Title Insurance Co |
Source: Public Records
Mortgage History
| Date | Status | Borrower | Loan Amount |
|---|---|---|---|
| Open | Freshour Jacob | $300,000 | |
| Previous Owner | Fujimoto Ryan T | $308,000 | |
| Previous Owner | Byerley James G | $160,050 |
Source: Public Records
Tax History
| Year | Tax Paid | Tax Assessment Tax Assessment Total Assessment is a certain percentage of the fair market value that is determined by local assessors to be the total taxable value of land and additions on the property. | Land | Improvement |
|---|---|---|---|---|
| 2025 | $6,992 | $383,360 | -- | -- |
| 2024 | $6,682 | $372,200 | -- | -- |
| 2023 | $6,529 | $361,360 | $0 | $0 |
| 2022 | $6,347 | $350,840 | $0 | $0 |
| 2021 | $6,188 | $368,670 | $0 | $0 |
| 2020 | $5,814 | $357,940 | $0 | $0 |
| 2019 | $5,663 | $347,520 | $0 | $0 |
| 2018 | $5,395 | $337,400 | $0 | $0 |
| 2017 | $5,174 | $327,580 | $0 | $0 |
| 2016 | $4,541 | $293,850 | $0 | $0 |
Source: Public Records
Map
Nearby Homes
- 7326 SE 252nd Ave
- 3259 SE 36th St
- 3169 SE 34th St
- 7830 SE 267th Ave
- 2910 SE Hillyard Rd
- 9690 SE 257th Dr
- 27238 SE Carl St
- 2624 SE Hale Way
- 1668 SE 35th Terrace
- 3788 SE 25th St
- 2813 SE Baker Ave
- 2600 SE Orient Dr
- 8105 SE 282nd Ave
- 2728 SE Acacia Place
- 2245 SE Wendy Dr
- 3780 SE 21st Dr
- 2925 SE Cleveland Dr
- 2073 SE Kane Ave
- 2037 SE Centurion Way
- 2678 SE Myrtlewood Way
- 7825 SE Kane Rd
- 7921 SE 257th Ave
- 7921 SE Kane Rd
- 7906 SE 257th Ave
- 7906 SE Kane Rd
- 7894 SE Kane Rd
- 7715 SE Telford Rd
- 25442 SE Mcnutt Rd
- 8117 SE 257th Ave
- 8117 SE Kane Rd
- 25601 SE Mcnutt Rd
- 7835 SE Telford Rd
- 8101 SE 257th Ave
- 8101 SE Kane Rd
- 8112 SE Kane Rd
- 8112 SE 257th Ave
- 8025 SE Telford Rd
- 25401 SE Mcnutt Rd
- 25346 SE Mcnutt Rd
- 7728 SE Telford Rd
Your Personal Tour Guide
Ask me questions while you tour the home.