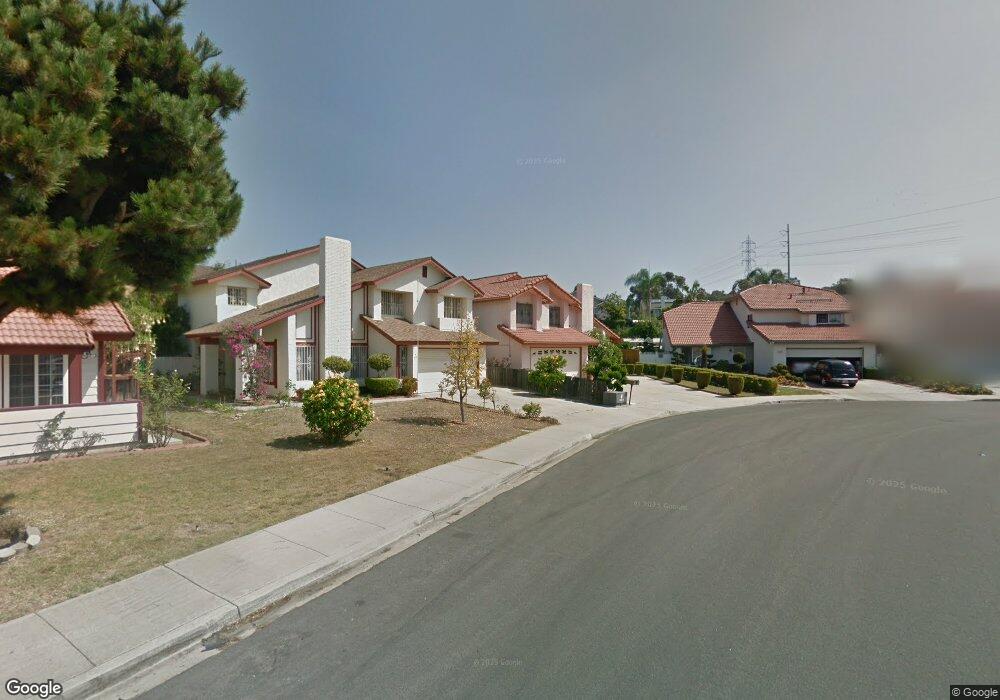
783 Cholla Rd Chula Vista, CA 91910
Rancho Del Rey NeighborhoodEstimated Value: $1,031,416 - $1,183,000
4
Beds
3
Baths
2,534
Sq Ft
$427/Sq Ft
Est. Value
About This Home
This home is located at 783 Cholla Rd, Chula Vista, CA 91910 and is currently estimated at $1,082,104, approximately $427 per square foot. 783 Cholla Rd is a home located in San Diego County with nearby schools including Casillas Elementary School, Rancho Del Rey Middle School, and Otay Ranch Senior High School.
Ownership History
Date
Name
Owned For
Owner Type
Purchase Details
Closed on
Mar 4, 2025
Sold by
Felizardo Guillerma and Endozo Marianito
Bought by
Restilito Endozo Llc and Felizardo
Current Estimated Value
Purchase Details
Closed on
Apr 24, 2023
Sold by
Isabel L Endozo Family Trust
Bought by
Endozo Guillerma and Endozo Marianito
Purchase Details
Closed on
Feb 20, 2016
Sold by
Endozo Isabel L
Bought by
Isabel L Endozo Family Trust
Create a Home Valuation Report for This Property
The Home Valuation Report is an in-depth analysis detailing your home's value as well as a comparison with similar homes in the area
Home Values in the Area
Average Home Value in this Area
Purchase History
| Date | Buyer | Sale Price | Title Company |
|---|---|---|---|
| Restilito Endozo Llc | -- | None Listed On Document | |
| Endozo Guillerma | -- | None Listed On Document | |
| Isabel L Endozo Family Trust | -- | None Listed On Document |
Source: Public Records
Tax History
| Year | Tax Paid | Tax Assessment Tax Assessment Total Assessment is a certain percentage of the fair market value that is determined by local assessors to be the total taxable value of land and additions on the property. | Land | Improvement |
|---|---|---|---|---|
| 2025 | $3,378 | $270,886 | $39,417 | $231,469 |
| 2024 | $3,378 | $265,576 | $38,645 | $226,931 |
| 2023 | $3,327 | $669,867 | $412,226 | $257,641 |
| 2022 | $8,060 | $669,867 | $412,226 | $257,641 |
| 2021 | $3,158 | $250,262 | $36,418 | $213,844 |
| 2020 | $3,005 | $247,697 | $36,045 | $211,652 |
| 2019 | $2,928 | $242,841 | $35,339 | $207,502 |
| 2018 | $2,878 | $238,081 | $34,647 | $203,434 |
| 2017 | $2,815 | $233,414 | $33,968 | $199,446 |
| 2016 | $2,748 | $228,838 | $33,302 | $195,536 |
| 2015 | $2,708 | $225,401 | $32,802 | $192,599 |
| 2014 | $2,662 | $220,987 | $32,160 | $188,827 |
Source: Public Records
Map
Nearby Homes
- 1065 Sage View
- 941 Redbud Rd
- 1008 Calma Dr
- 695 Calma Place
- 871 Blackwood Rd
- 820 Cardamom Ct
- 826 Cinnamon Ct
- 715 Paso de Luz
- 664 Rainbow Dr
- 1201 Halley Ct
- 945 E J St
- 843 Caminito Las Olas
- 937 Paseo la Cresta
- 1233 Equinox Way
- 1038 Dorado Ct
- 1139 Ocelot Ave
- 476 Montclair St
- 940 Sullivan Ct
- 445 Montcalm St
- 919 Caminito Estrella
Your Personal Tour Guide
Ask me questions while you tour the home.