Estimated Value: $642,000 - $740,000
3
Beds
2
Baths
2,144
Sq Ft
$314/Sq Ft
Est. Value
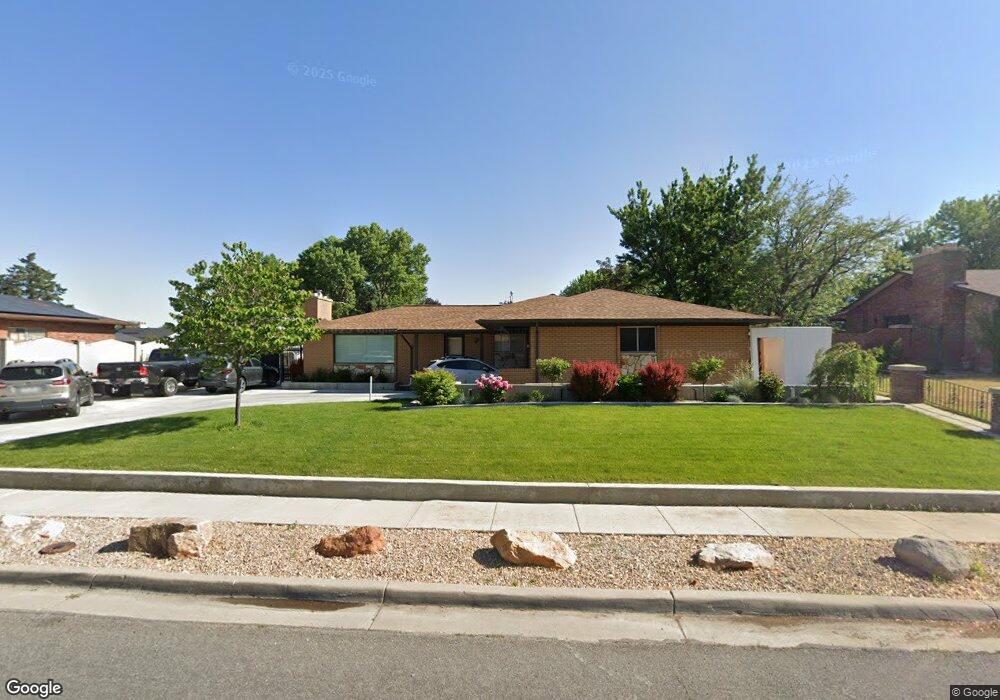
About This Home
This home is located at 783 Savannah Dr, Sandy, UT 84094 and is currently estimated at $673,830, approximately $314 per square foot. 783 Savannah Dr is a home located in Salt Lake County with nearby schools including Altara Elementary School, Challenger School - Sandy, and Gateway Academy.
Ownership History
Date
Name
Owned For
Owner Type
Purchase Details
Closed on
Aug 27, 2020
Sold by
Keller Jeffery A and Keller Michelle
Bought by
Keller Jeffery and Keller Michaelle
Current Estimated Value
Purchase Details
Closed on
Jul 1, 2004
Sold by
Doxey Sharlee
Bought by
Keller Jeffery A and Keller Michelle
Purchase Details
Closed on
Jan 13, 2003
Sold by
Doxey Sharlee and Stockdale Sharlee Doxey
Bought by
Doxey Sharlee
Purchase Details
Closed on
Jun 20, 2002
Sold by
Stockdale John Dee
Bought by
Doxey Sharlee
Purchase Details
Closed on
Sep 15, 1999
Sold by
Doxey Sharlee
Bought by
Stockdale John Dee and Stockdale Sharlee Doxey
Purchase Details
Closed on
Aug 24, 1999
Sold by
Doxey Sharlee
Bought by
Stockdale John Dee and Stockdale Sharlee Doxey
Purchase Details
Closed on
Dec 29, 1994
Sold by
Garnham Marlene J and Doxey Sharlee
Bought by
Garnham Marlene J and Doxey Sharlee
Create a Home Valuation Report for This Property
The Home Valuation Report is an in-depth analysis detailing your home's value as well as a comparison with similar homes in the area
Home Values in the Area
Average Home Value in this Area
Purchase History
| Date | Buyer | Sale Price | Title Company |
|---|---|---|---|
| Keller Jeffery | -- | None Available | |
| Keller Jeffery | -- | None Available | |
| Keller Jeffery A | -- | Backman Stewart Title Svcs | |
| Doxey Sharlee | -- | -- | |
| Doxey Sharlee | -- | -- | |
| Doxey Sharlee | -- | -- | |
| Stockdale John Dee | -- | -- | |
| Stockdale John Dee | -- | -- | |
| Garnham Marlene J | -- | -- |
Source: Public Records
Tax History Compared to Growth
Tax History
| Year | Tax Paid | Tax Assessment Tax Assessment Total Assessment is a certain percentage of the fair market value that is determined by local assessors to be the total taxable value of land and additions on the property. | Land | Improvement |
|---|---|---|---|---|
| 2025 | $3,324 | $660,000 | $145,400 | $514,600 |
| 2024 | $3,324 | $627,000 | $137,000 | $490,000 |
| 2023 | $3,016 | $577,500 | $130,200 | $447,300 |
| 2022 | $3,194 | $588,500 | $127,700 | $460,800 |
| 2021 | $2,862 | $449,000 | $111,000 | $338,000 |
| 2020 | $2,741 | $406,100 | $102,100 | $304,000 |
| 2019 | $2,668 | $385,700 | $102,100 | $283,600 |
| 2018 | $2,281 | $344,800 | $102,100 | $242,700 |
| 2017 | $2,161 | $312,700 | $95,200 | $217,500 |
| 2016 | $2,113 | $295,800 | $95,200 | $200,600 |
| 2015 | $2,037 | $264,300 | $92,400 | $171,900 |
| 2014 | $2,036 | $259,500 | $92,400 | $167,100 |
Source: Public Records
Map
Nearby Homes
- 11025 S Grapevine Cove Unit B205
- 10973 S Avila Dr
- 11035 S Grapevine Cove Unit 204
- 11075 S Grape Arbor Place Unit 206
- 11085 S Grape Arbor Place Unit 102
- 11143 Sandy Dunes Dr
- 517 E 11000 S
- 409 E 11000 S
- 11186 S 1000 E Unit 1
- 11202 S 1000 E Unit 3
- 10454 S Sand Dollar Dr
- 601 E Pali St
- 717 Sand Dollar Dr
- 932 E 10465 S
- 1053 E 10600 S
- 10681 S 300 E
- 478 E Meadow Hill Dr
- 389 E 10560 S
- 10499 S Carnation Dr
- 10442 S Carnation Dr
- 771 Savannah Dr
- 795 Savannah Dr
- 786 E Pecos Dr
- 774 Pecos Dr
- 798 Pecos Dr
- 798 E Pecos Dr
- 784 Savannah Dr
- 761 Savannah Dr
- 807 E Savannah Dr
- 807 Savannah Dr
- 796 E Savannah Dr
- 796 Savannah Dr
- 772 Savannah Dr
- 772 E Savannah Dr
- 764 Pecos Dr
- 764 E Pecos Dr
- 810 Pecos Dr
- 810 E Pecos Dr
- 808 Savannah Dr
- 808 E Savannah Dr