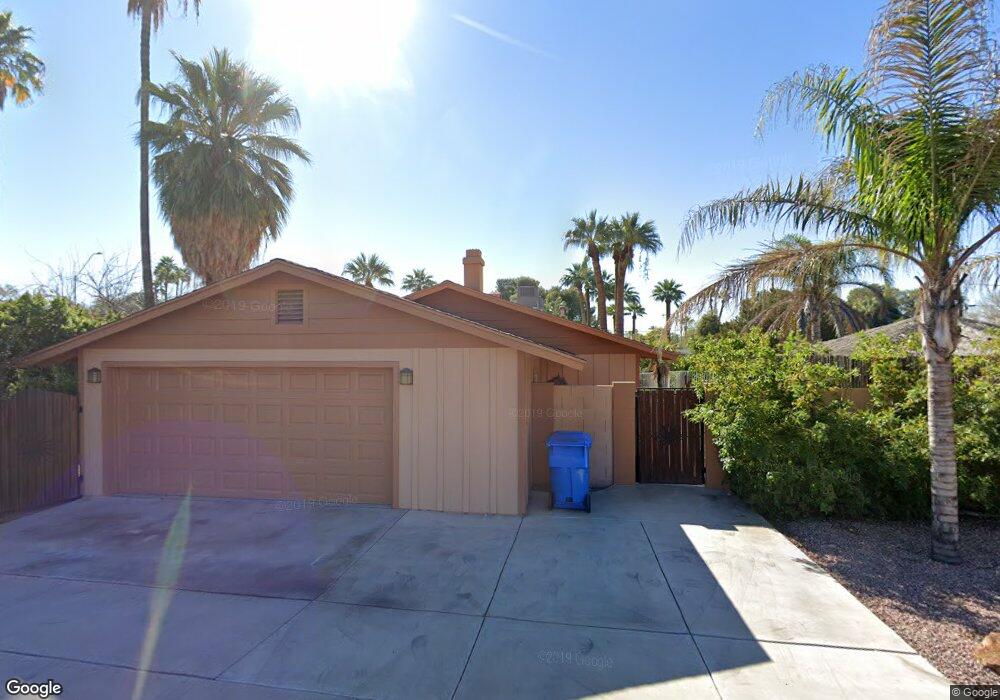
7838 N 7th Ave Phoenix, AZ 85021
Alhambra NeighborhoodEstimated Value: $680,000 - $985,000
Studio
3
Baths
2,301
Sq Ft
$347/Sq Ft
Est. Value
About This Home
This home is located at 7838 N 7th Ave, Phoenix, AZ 85021 and is currently estimated at $798,554, approximately $347 per square foot. 7838 N 7th Ave is a home located in Maricopa County with nearby schools including Richard E Miller School, Royal Palm Middle School, and Washington High School.
Ownership History
Date
Name
Owned For
Owner Type
Purchase Details
Closed on
Dec 22, 2022
Sold by
Coley Gary L
Bought by
Coley Family Trust
Current Estimated Value
Purchase Details
Closed on
Sep 12, 2000
Sold by
Dorociak Sharon N
Bought by
Coley Gary L and Jenkins Bette L
Home Financials for this Owner
Home Financials are based on the most recent Mortgage that was taken out on this home.
Original Mortgage
$171,850
Interest Rate
8.11%
Mortgage Type
New Conventional
Purchase Details
Closed on
Apr 8, 1999
Sold by
Rodriguez Jose Luis Araiza
Bought by
Dorociak Robert D and Dorociak Sharon N
Purchase Details
Closed on
Jul 15, 1997
Sold by
Rodriguez Blanca L
Bought by
Rodriguez Jose Luis Araiza
Purchase Details
Closed on
Oct 28, 1994
Sold by
American Missionary Church and Leo Joanna
Bought by
Dorociak Robert D and Dorociak Sharon N
Create a Home Valuation Report for This Property
The Home Valuation Report is an in-depth analysis detailing your home's value as well as a comparison with similar homes in the area
Home Values in the Area
Average Home Value in this Area
Purchase History
| Date | Buyer | Sale Price | Title Company |
|---|---|---|---|
| Coley Family Trust | -- | -- | |
| Coley Gary L | $169,800 | Security Title Agency | |
| Dorociak Robert D | $144,593 | Security Title Agency | |
| Rodriguez Jose Luis Araiza | -- | Ati Title Agency | |
| Rodriguez Jose Luis Araiza | $177,900 | Ati Title Agency | |
| Dorociak Robert D | -- | -- |
Source: Public Records
Mortgage History
| Date | Status | Borrower | Loan Amount |
|---|---|---|---|
| Previous Owner | Coley Gary L | $171,850 |
Source: Public Records
Tax History
| Year | Tax Paid | Tax Assessment Tax Assessment Total Assessment is a certain percentage of the fair market value that is determined by local assessors to be the total taxable value of land and additions on the property. | Land | Improvement |
|---|---|---|---|---|
| 2025 | $4,151 | $37,237 | -- | -- |
| 2024 | $3,913 | $35,463 | -- | -- |
| 2023 | $3,913 | $58,580 | $11,710 | $46,870 |
| 2022 | $3,775 | $44,810 | $8,960 | $35,850 |
| 2021 | $3,870 | $40,900 | $8,180 | $32,720 |
| 2020 | $3,766 | $38,670 | $7,730 | $30,940 |
| 2019 | $3,697 | $36,160 | $7,230 | $28,930 |
| 2018 | $3,593 | $34,350 | $6,870 | $27,480 |
| 2017 | $3,582 | $32,160 | $6,430 | $25,730 |
| 2016 | $3,518 | $27,070 | $5,410 | $21,660 |
| 2015 | $3,263 | $22,860 | $4,570 | $18,290 |
Source: Public Records
Map
Nearby Homes
- 7830 N 7th Ave
- 8037 N 7th Ave
- 641 W Linger Ln
- 524 W Harmont Dr
- 8001 N 5th Ave
- 7848 N 5th Ave
- 1001 W Northern Ave
- 7730 N 7th Ave
- 514 W Hayward Ave
- 223 W Augusta Ave
- 7720 N 3rd Ave
- 1109 W Frier Dr
- 8324 N 8th Ave
- 625 W Echo Ln
- 100 W Northern Ave Unit 6
- 100 W Northern Ave Unit 7
- 100 W Northern Ave Unit 15
- 100 W Northern Ave Unit 4
- 8464 N 7th Ave
- 640 W Echo Ln
- 711 W Northern Ave
- 642 W Linger Ln
- 7822 N 7th Ave
- 820 W Linger Ln
- 721 W Northern Ave
- 716 W Northern Ave
- 700 W Northern Ave
- 8007 N 8th Ave
- 520 W Northern Ave Unit 106
- 822 W Linger Ln
- 7812 N 7th Ave
- 812 W Linger Ln
- 8015 N 8th Ave
- 801 W Northern Ave
- 510 W Northern Ave
- 631 W Linger Ln
- 8000 N 8th Ave
- 8004 N 8th Ave
- 8007 N 7th Ave
- 642 W Augusta Ave
Your Personal Tour Guide
Ask me questions while you tour the home.