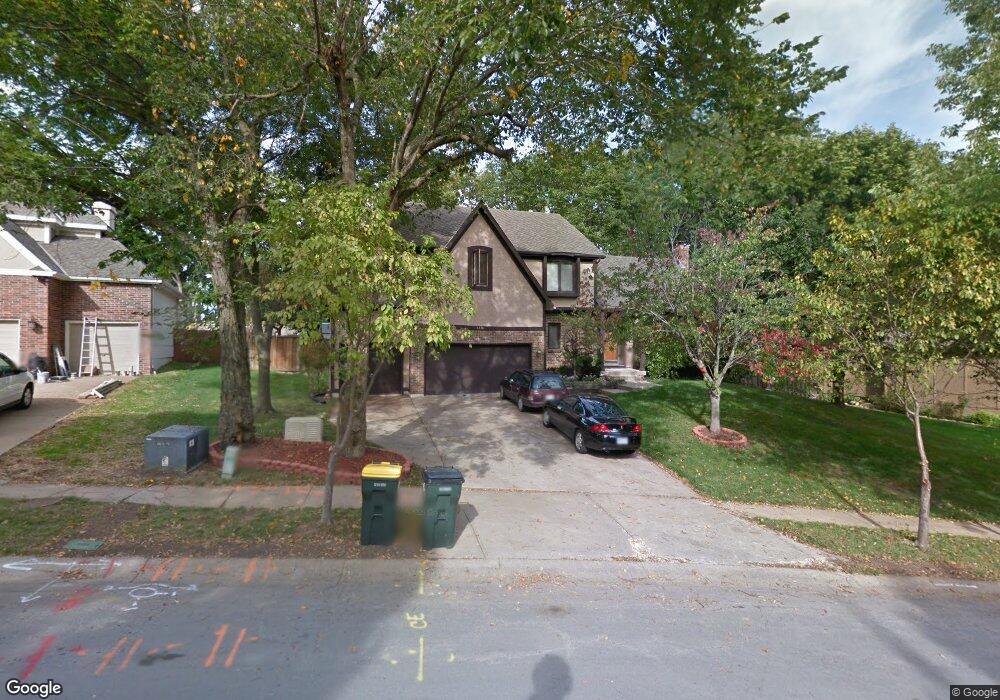
7838 Oakview Ln Shawnee, KS 66216
Estimated Value: $550,829 - $581,000
4
Beds
4
Baths
2,765
Sq Ft
$204/Sq Ft
Est. Value
About This Home
This home is located at 7838 Oakview Ln, Shawnee, KS 66216 and is currently estimated at $563,207, approximately $203 per square foot. 7838 Oakview Ln is a home located in Johnson County with nearby schools including Mill Creek Elementary School, Trailridge Middle School, and Shawnee Mission Northwest High School.
Ownership History
Date
Name
Owned For
Owner Type
Purchase Details
Closed on
Aug 8, 2018
Sold by
Keller David Ray and David Ray Keller Trust
Bought by
Keller David R and Keller Andrea D
Current Estimated Value
Purchase Details
Closed on
May 23, 2015
Sold by
Keller David R and Keller Andrea D
Bought by
Keller David Ray
Home Financials for this Owner
Home Financials are based on the most recent Mortgage that was taken out on this home.
Original Mortgage
$178,000
Interest Rate
3.71%
Mortgage Type
New Conventional
Purchase Details
Closed on
Mar 23, 2012
Sold by
Keller David Ray
Bought by
Keller David R and Keller Andrea D
Home Financials for this Owner
Home Financials are based on the most recent Mortgage that was taken out on this home.
Original Mortgage
$206,040
Interest Rate
3.37%
Mortgage Type
FHA
Create a Home Valuation Report for This Property
The Home Valuation Report is an in-depth analysis detailing your home's value as well as a comparison with similar homes in the area
Home Values in the Area
Average Home Value in this Area
Purchase History
| Date | Buyer | Sale Price | Title Company |
|---|---|---|---|
| Keller David R | -- | None Available | |
| Keller David Ray | -- | None Available | |
| Keller David R | -- | None Available | |
| Keller David R | -- | First United Title Agency |
Source: Public Records
Mortgage History
| Date | Status | Borrower | Loan Amount |
|---|---|---|---|
| Closed | Keller David R | $178,000 | |
| Closed | Keller David R | $206,040 |
Source: Public Records
Tax History Compared to Growth
Tax History
| Year | Tax Paid | Tax Assessment Tax Assessment Total Assessment is a certain percentage of the fair market value that is determined by local assessors to be the total taxable value of land and additions on the property. | Land | Improvement |
|---|---|---|---|---|
| 2024 | $6,458 | $58,202 | $10,961 | $47,241 |
| 2023 | $6,058 | $53,843 | $9,527 | $44,316 |
| 2022 | $5,634 | $50,048 | $8,279 | $41,769 |
| 2021 | $5,187 | $43,815 | $8,279 | $35,536 |
| 2020 | $4,893 | $40,906 | $8,279 | $32,627 |
| 2019 | $4,812 | $40,216 | $7,199 | $33,017 |
| 2018 | $4,893 | $40,929 | $7,199 | $33,730 |
| 2017 | $4,677 | $37,559 | $7,199 | $30,360 |
| 2016 | $4,516 | $35,811 | $7,199 | $28,612 |
| 2015 | $4,319 | $34,477 | $7,198 | $27,279 |
| 2013 | -- | $28,175 | $7,198 | $20,977 |
Source: Public Records
Map
Nearby Homes
- 14828 W 83rd Place
- 8033 Hall St
- 7325 Oakview St
- 15322 W 83rd St
- 14915 W 84th Terrace
- 15615 W 81st St
- 13716 W 75th Terrace
- 14620 W 84th St
- 8403 Swarner Dr
- 13800 W 75th Ct
- 15322 W 83rd Terrace
- 14424 W 84th Terrace
- 15529 W 83rd Terrace
- 7219 Allman Rd
- 7239 Allman Rd
- 7221 Allman Rd
- 7237 Allman Rd
- 7231 Allman Rd
- 7514 Caenen Lake Rd
- 13903 W 71st Place
- 7834 Oakview Ln
- 7842 Oakview Ln
- 7847 Alden Rd
- 7835 Oakview Ln
- 7835 Alden Rd
- 14603 W 78th St
- 7841 Oakview Ln
- 7827 Oakview Ln
- 7829 Alden Rd
- 14607 W 78th St
- 7825 Oakview Ln
- 14600 W 78th St
- 7823 Alden Rd
- 7901 Alden St
- 14604 W 78th St
- 7844 Alden Rd
- 7909 Randall Dr
- 7850 Alden Rd
- 7838 Alden Rd
- 7906 Alden St