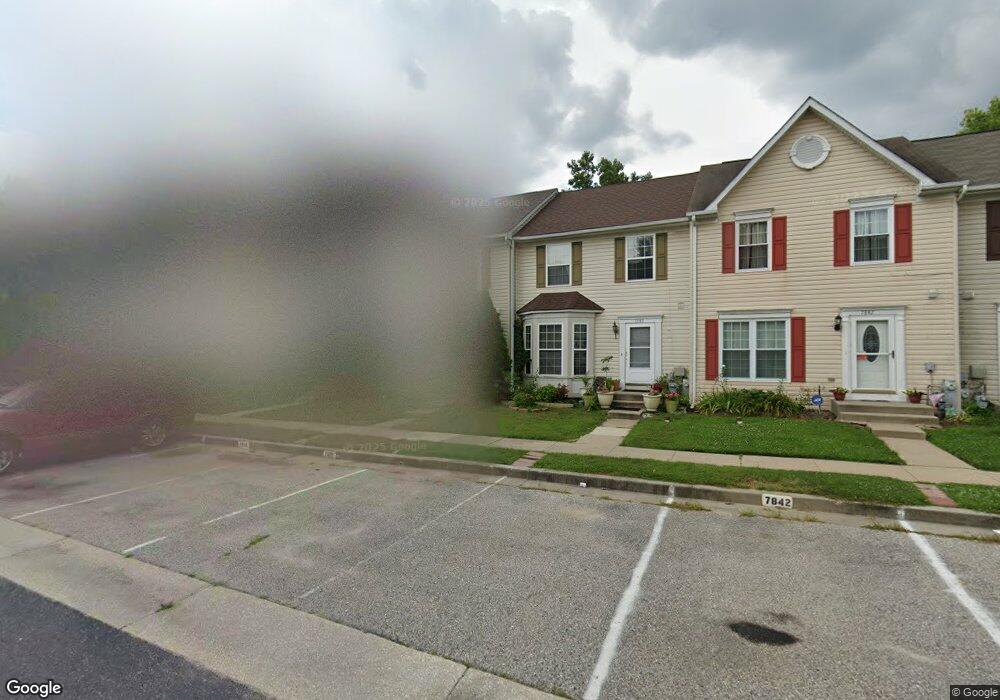
7838 Rolling View Ave Nottingham, MD 21236
Estimated Value: $291,000 - $323,000
4
Beds
4
Baths
1,280
Sq Ft
$240/Sq Ft
Est. Value
About This Home
This home is located at 7838 Rolling View Ave, Nottingham, MD 21236 and is currently estimated at $306,981, approximately $239 per square foot. 7838 Rolling View Ave is a home located in Baltimore County with nearby schools including Fullerton Elementary School, Parkville Middle & Center of Technology, and Parkville High School.
Ownership History
Date
Name
Owned For
Owner Type
Purchase Details
Closed on
Jul 24, 2009
Sold by
Lubin Kerline
Bought by
Stanley Michael J and Stanley Toroda D
Current Estimated Value
Purchase Details
Closed on
Jul 31, 2002
Sold by
Secretary Of Housing
Bought by
Lubin Kerline
Purchase Details
Closed on
Mar 20, 2002
Sold by
Anderson Thomas A
Bought by
Secretary Of Housing
Purchase Details
Closed on
Jun 30, 1999
Sold by
Anderson Mary R
Bought by
Anderson Thomas A and Anderson Tammie D
Purchase Details
Closed on
May 22, 1997
Sold by
Fitch Avenue Limited Partnership
Bought by
Anderson Mary R and Anderson Tammie D
Create a Home Valuation Report for This Property
The Home Valuation Report is an in-depth analysis detailing your home's value as well as a comparison with similar homes in the area
Home Values in the Area
Average Home Value in this Area
Purchase History
| Date | Buyer | Sale Price | Title Company |
|---|---|---|---|
| Stanley Michael J | $217,500 | -- | |
| Lubin Kerline | $118,000 | -- | |
| Secretary Of Housing | $120,000 | -- | |
| Anderson Thomas A | -- | -- | |
| Anderson Mary R | $112,000 | -- |
Source: Public Records
Tax History
| Year | Tax Paid | Tax Assessment Tax Assessment Total Assessment is a certain percentage of the fair market value that is determined by local assessors to be the total taxable value of land and additions on the property. | Land | Improvement |
|---|---|---|---|---|
| 2025 | $3,737 | $241,133 | -- | -- |
| 2024 | $3,737 | $226,667 | $0 | $0 |
| 2023 | $1,794 | $212,200 | $66,500 | $145,700 |
| 2022 | $3,517 | $209,400 | $0 | $0 |
| 2021 | $3,534 | $206,600 | $0 | $0 |
| 2020 | $3,534 | $203,800 | $66,500 | $137,300 |
| 2019 | $3,239 | $195,967 | $0 | $0 |
| 2018 | $3,048 | $188,133 | $0 | $0 |
| 2017 | $2,840 | $180,300 | $0 | $0 |
| 2016 | $2,799 | $178,533 | $0 | $0 |
| 2015 | $2,799 | $176,767 | $0 | $0 |
| 2014 | $2,799 | $175,000 | $0 | $0 |
Source: Public Records
Map
Nearby Homes
- 4102 Asbury Ave
- 3612 Rockberry Rd
- 8633 Fowler Ave
- 8602 David Ave
- 3409 Acton Rd
- 3339 Acton Rd
- 3711 Green Oak Ct
- 229 Sipple Ave
- 3407 Orbitan Rd
- 8716 Maravoss Ln
- 204 Lyndale Ave
- 3302 Garnet Rd
- 7809 Bennerton Dr
- 4416 Fullerton Ave
- 109 Elinor Ave
- 3107 California Ave
- 1 Broadleaf Ct
- 3049 California Ave
- 7839 Bagley Ave
- 3046 Woodside Ave
- 7836 Rolling View Ave
- 7840 Rolling View Ave
- 7842 Rolling View Ave
- 7834 Rolling View Ave
- 7832 Rolling View Ave
- 7844 Rolling View Ave
- 7830 Rolling View Ave
- 7828 Rolling View Ave
- 7846 Rolling View Ave
- 7848 Rolling View Ave
- 7826 Rolling View Ave
- 7850 Rolling View Ave
- 7823 Rolling View Ave
- 7825 Rolling View Ave
- 7821 Rolling View Ave
- 7827 Rolling View Ave
- 7819 Rolling View Ave
- 7829 Rolling View Ave
- 7824 Rolling View Ave
- 7852 Rolling View Ave
Your Personal Tour Guide
Ask me questions while you tour the home.