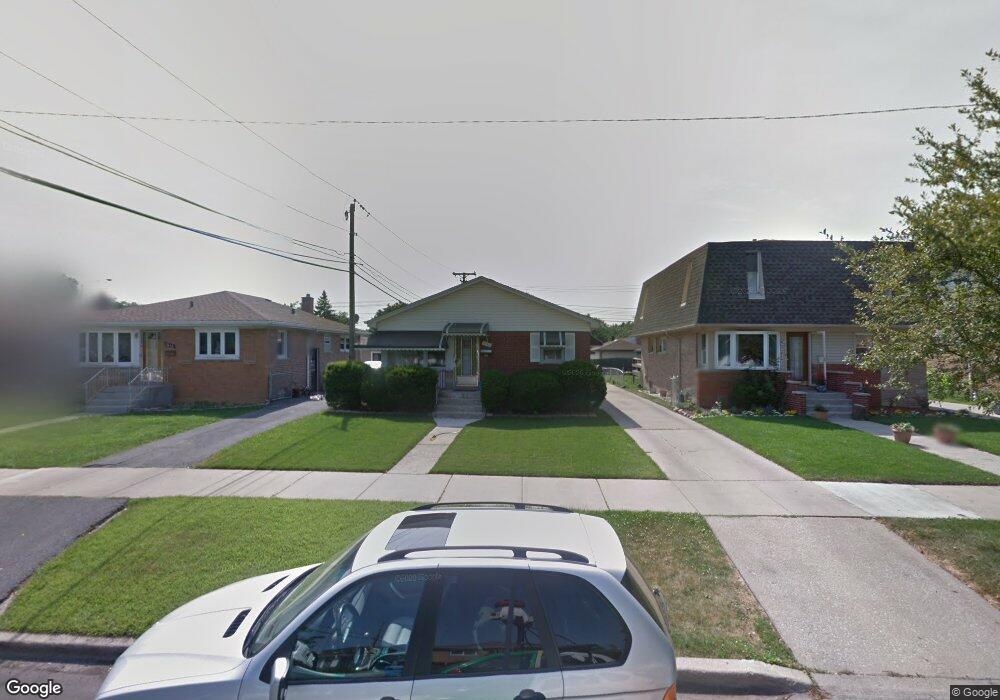
7842 S Kolmar Ave Chicago, IL 60652
Scottsdale NeighborhoodEstimated Value: $256,000 - $289,495
2
Beds
1
Bath
1,040
Sq Ft
$263/Sq Ft
Est. Value
About This Home
This home is located at 7842 S Kolmar Ave, Chicago, IL 60652 and is currently estimated at $273,624, approximately $263 per square foot. 7842 S Kolmar Ave is a home located in Cook County with nearby schools including Stevenson Elementary School, Bogan Computer Technical High School, and St Bede-Venerable School.
Ownership History
Date
Name
Owned For
Owner Type
Purchase Details
Closed on
May 24, 2016
Sold by
Calini & Associates Inc
Bought by
Arreola Yesenia A and Flores Carlos A Diaz
Current Estimated Value
Home Financials for this Owner
Home Financials are based on the most recent Mortgage that was taken out on this home.
Original Mortgage
$154,761
Outstanding Balance
$123,560
Interest Rate
3.75%
Mortgage Type
FHA
Estimated Equity
$150,064
Purchase Details
Closed on
Mar 11, 2015
Sold by
Zavala
Bought by
Calini & Associates Inc
Purchase Details
Closed on
Oct 4, 2004
Sold by
Boland John and Boland Maureen
Bought by
Zavala Victor and Zavala Olga
Home Financials for this Owner
Home Financials are based on the most recent Mortgage that was taken out on this home.
Original Mortgage
$215,616
Interest Rate
5.82%
Mortgage Type
FHA
Create a Home Valuation Report for This Property
The Home Valuation Report is an in-depth analysis detailing your home's value as well as a comparison with similar homes in the area
Home Values in the Area
Average Home Value in this Area
Purchase History
| Date | Buyer | Sale Price | Title Company |
|---|---|---|---|
| Arreola Yesenia A | $160,000 | Attorney | |
| Calini & Associates Inc | $94,000 | None Available | |
| Zavala Victor | $219,000 | Pntn |
Source: Public Records
Mortgage History
| Date | Status | Borrower | Loan Amount |
|---|---|---|---|
| Open | Arreola Yesenia A | $154,761 | |
| Previous Owner | Zavala Victor | $215,616 |
Source: Public Records
Tax History Compared to Growth
Tax History
| Year | Tax Paid | Tax Assessment Tax Assessment Total Assessment is a certain percentage of the fair market value that is determined by local assessors to be the total taxable value of land and additions on the property. | Land | Improvement |
|---|---|---|---|---|
| 2024 | $4,031 | $23,000 | $3,276 | $19,724 |
| 2023 | $3,930 | $19,000 | $4,095 | $14,905 |
| 2022 | $3,930 | $19,000 | $4,095 | $14,905 |
| 2021 | $3,821 | $19,000 | $4,095 | $14,905 |
| 2020 | $3,303 | $14,729 | $4,095 | $10,634 |
| 2019 | $3,346 | $16,550 | $4,095 | $12,455 |
| 2018 | $3,290 | $16,550 | $4,095 | $12,455 |
| 2017 | $3,234 | $14,926 | $3,549 | $11,377 |
| 2016 | $2,506 | $14,926 | $3,549 | $11,377 |
| 2015 | $2,271 | $14,926 | $3,549 | $11,377 |
| 2014 | $2,087 | $13,732 | $3,276 | $10,456 |
| 2013 | $2,036 | $13,732 | $3,276 | $10,456 |
Source: Public Records
Map
Nearby Homes
- 7817 S Kenton Ave
- 7746 S Kolmar Ave
- 7845 S Kilpatrick Ave
- 7958 S Knox Ave
- 7715 S Kilpatrick Ave
- 8001 S Kilpatrick Ave
- 7704 S Kilpatrick Ave
- 7917 S Kostner Ave
- 8053 S Kenton Ave
- 8069 S Kolmar Ave
- 4350 W Ford City Dr Unit B1402
- 8100 S Kilpatrick Ave
- 4300 W Ford City Dr Unit A1301
- 7832 Lamon Ave
- 4244 W 77th St Unit 102
- 7829 Laporte Ave
- 4222 W 77th St Unit 202
- 4222 W 77th St Unit 204
- 7964 S Tripp Ave
- 4327 W 81st St
- 7846 S Kolmar Ave
- 7838 S Kolmar Ave
- 7850 S Kolmar Ave
- 7834 S Kolmar Ave
- 7854 S Kolmar Ave
- 7843 S Kenton Ave
- 7847 S Kenton Ave
- 7839 S Kenton Ave
- 7851 S Kenton Ave
- 7835 S Kenton Ave
- 7826 S Kolmar Ave
- 7855 S Kenton Ave
- 7831 S Kenton Ave
- 7843 S Kolmar Ave
- 7839 S Kolmar Ave
- 7847 S Kolmar Ave
- 7822 S Kolmar Ave
- 7835 S Kolmar Ave
- 7851 S Kolmar Ave
- 7827 S Kenton Ave