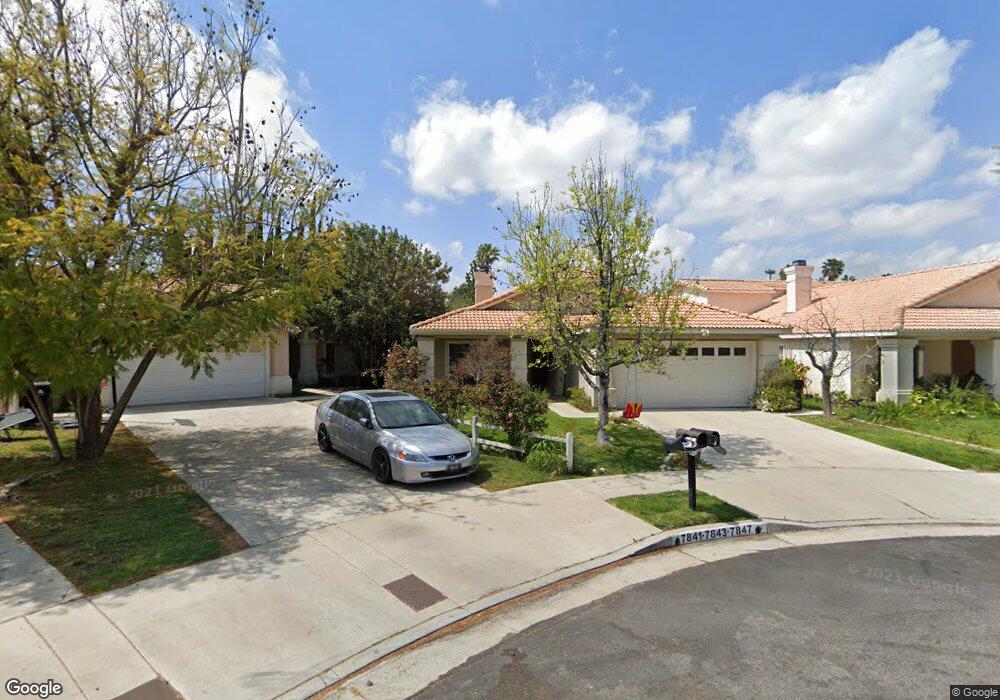
7847 Canby Ave Reseda, CA 91335
Estimated Value: $817,016 - $994,000
3
Beds
2
Baths
1,598
Sq Ft
$562/Sq Ft
Est. Value
About This Home
This home is located at 7847 Canby Ave, Reseda, CA 91335 and is currently estimated at $897,504, approximately $561 per square foot. 7847 Canby Ave is a home located in Los Angeles County with nearby schools including Blythe Street Elementary, Northridge Middle School, and Northridge Academy High.
Ownership History
Date
Name
Owned For
Owner Type
Purchase Details
Closed on
Oct 19, 2017
Sold by
Gasta Kathleen
Bought by
Gasta Paul M and Gasta Kathleen
Current Estimated Value
Purchase Details
Closed on
Aug 1, 2002
Sold by
Gasta Kathleen
Bought by
Gasta Paul M and Gasta Kathleen
Purchase Details
Closed on
Nov 22, 2000
Sold by
Dosaj Raj and Shields Ana M
Bought by
Gasta Kathleen
Home Financials for this Owner
Home Financials are based on the most recent Mortgage that was taken out on this home.
Original Mortgage
$175,000
Interest Rate
7.08%
Purchase Details
Closed on
Oct 1, 1996
Sold by
Maximum Homes Llc
Bought by
Dosaj Raj and Shields Ana M
Home Financials for this Owner
Home Financials are based on the most recent Mortgage that was taken out on this home.
Original Mortgage
$186,650
Interest Rate
8.1%
Create a Home Valuation Report for This Property
The Home Valuation Report is an in-depth analysis detailing your home's value as well as a comparison with similar homes in the area
Home Values in the Area
Average Home Value in this Area
Purchase History
| Date | Buyer | Sale Price | Title Company |
|---|---|---|---|
| Gasta Paul M | -- | None Available | |
| Gasta Paul M | -- | None Available | |
| Gasta Paul M | -- | -- | |
| Gasta Kathleen | $250,000 | American Title Co | |
| Gasta Kathleen | -- | American Title Co | |
| Dosaj Raj | $196,500 | Chicago Title Company |
Source: Public Records
Mortgage History
| Date | Status | Borrower | Loan Amount |
|---|---|---|---|
| Previous Owner | Gasta Kathleen | $175,000 | |
| Previous Owner | Dosaj Raj | $186,650 |
Source: Public Records
Tax History
| Year | Tax Paid | Tax Assessment Tax Assessment Total Assessment is a certain percentage of the fair market value that is determined by local assessors to be the total taxable value of land and additions on the property. | Land | Improvement |
|---|---|---|---|---|
| 2025 | $4,744 | $376,685 | $196,632 | $180,053 |
| 2024 | $4,744 | $369,300 | $192,777 | $176,523 |
| 2023 | $4,656 | $362,060 | $188,998 | $173,062 |
| 2022 | $4,444 | $354,962 | $185,293 | $169,669 |
| 2021 | $4,385 | $348,003 | $181,660 | $166,343 |
| 2019 | $4,257 | $337,683 | $176,273 | $161,410 |
| 2018 | $4,169 | $331,063 | $172,817 | $158,246 |
| 2016 | $3,974 | $318,209 | $166,107 | $152,102 |
| 2015 | $3,918 | $313,430 | $163,612 | $149,818 |
| 2014 | $3,937 | $307,292 | $160,408 | $146,884 |
Source: Public Records
Map
Nearby Homes
- 18326 Elkwood St
- 18320 Ingomar St
- 8031 Canby Ave Unit 4
- 7651 Reseda Blvd Unit 3T
- 7651 Reseda Blvd Unit 12T
- 7641 Reseda Blvd Unit 87Z
- 7719 Nestle Ave
- 7625 Reseda Blvd Unit 202
- 7625 Reseda Blvd Unit 104
- 8045 Darby Place
- 18347 Saticoy St Unit 28
- 18347 Saticoy St Unit 35
- 18347 Saticoy St Unit 24
- 18228 Keswick St
- 18229 Strathern St
- 8051 Etiwanda Ave
- 8111 Canby Ave Unit 3
- 8120 Canby Ave
- 7732 Garden Grove Ave
- 8134 Baird Ave
- 7851 Canby Ave
- 7843 Canby Ave
- 7841 Canby Ave
- 18442 Arminta St
- 18434 Arminta St
- 7840 Canby Ave
- 7850 Canby Ave
- 7848 Canby Ave
- 7842 Canby Ave
- 18422 Arminta St
- 7850 Reseda Blvd
- 7844 Canby Ave
- 18418 Arminta St
- 18427 Arminta St Unit 2
- 18423 Arminta St
- 18425 Arminta St
- 18408 Arminta St
- 18433 Arminta St
- 18431 Arminta St
- 18419 Arminta St Unit 6
Your Personal Tour Guide
Ask me questions while you tour the home.