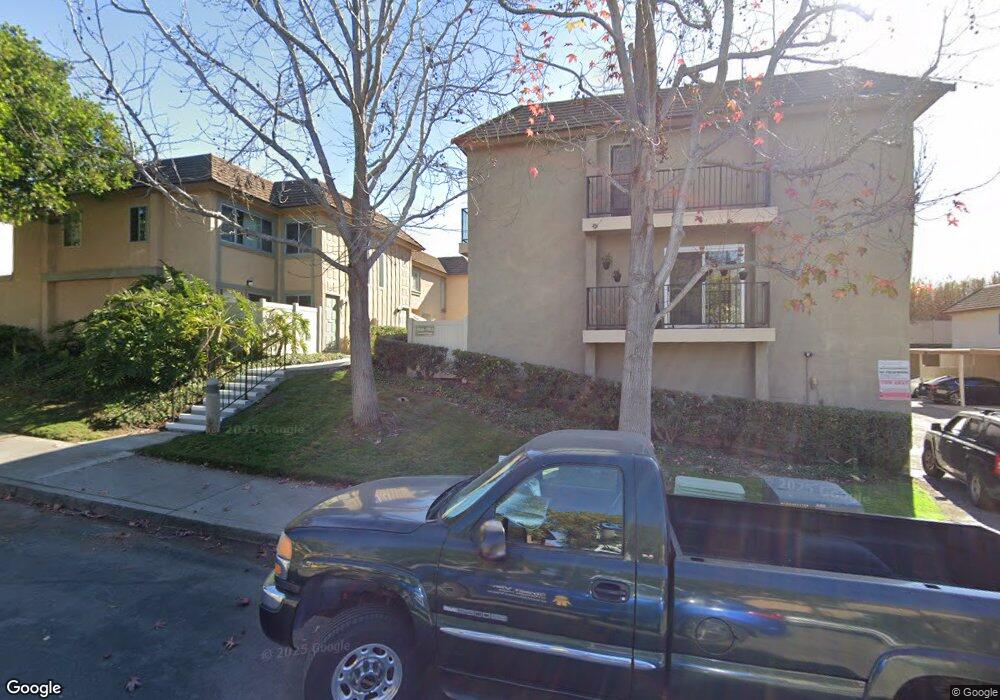
7847 Hummingbird Ln San Diego, CA 92123
Birdland NeighborhoodEstimated Value: $688,000 - $736,894
4
Beds
3
Baths
1,454
Sq Ft
$490/Sq Ft
Est. Value
About This Home
This home is located at 7847 Hummingbird Ln, San Diego, CA 92123 and is currently estimated at $712,974, approximately $490 per square foot. 7847 Hummingbird Ln is a home located in San Diego County with nearby schools including Fletcher Elementary School, Montgomery Middle School, and San Diego Cooperative Charter School.
Ownership History
Date
Name
Owned For
Owner Type
Purchase Details
Closed on
Apr 29, 2002
Sold by
Kurtz Michael G
Bought by
Kurtz Nathan A
Current Estimated Value
Home Financials for this Owner
Home Financials are based on the most recent Mortgage that was taken out on this home.
Original Mortgage
$166,500
Outstanding Balance
$70,356
Interest Rate
6.94%
Mortgage Type
Purchase Money Mortgage
Estimated Equity
$642,618
Purchase Details
Closed on
Feb 24, 2000
Sold by
Kurtz Shannon L
Bought by
Kurtz Michael G
Home Financials for this Owner
Home Financials are based on the most recent Mortgage that was taken out on this home.
Original Mortgage
$148,950
Interest Rate
8.27%
Mortgage Type
FHA
Purchase Details
Closed on
Feb 11, 2000
Sold by
Brigner Vernon A and Brigner Sally A
Bought by
Kurtz Nathan A and Kurtz Michael G
Home Financials for this Owner
Home Financials are based on the most recent Mortgage that was taken out on this home.
Original Mortgage
$148,950
Interest Rate
8.27%
Mortgage Type
FHA
Purchase Details
Closed on
Oct 9, 1990
Purchase Details
Closed on
Dec 30, 1983
Create a Home Valuation Report for This Property
The Home Valuation Report is an in-depth analysis detailing your home's value as well as a comparison with similar homes in the area
Home Values in the Area
Average Home Value in this Area
Purchase History
| Date | Buyer | Sale Price | Title Company |
|---|---|---|---|
| Kurtz Nathan A | -- | New Century Title | |
| Kurtz Michael G | -- | Guardian Title Company | |
| Kurtz Nathan A | $165,500 | Guardian Title Co | |
| -- | $143,000 | -- | |
| -- | $91,000 | -- |
Source: Public Records
Mortgage History
| Date | Status | Borrower | Loan Amount |
|---|---|---|---|
| Open | Kurtz Nathan A | $166,500 | |
| Closed | Kurtz Nathan A | $148,950 |
Source: Public Records
Tax History Compared to Growth
Tax History
| Year | Tax Paid | Tax Assessment Tax Assessment Total Assessment is a certain percentage of the fair market value that is determined by local assessors to be the total taxable value of land and additions on the property. | Land | Improvement |
|---|---|---|---|---|
| 2025 | $3,008 | $254,340 | $93,253 | $161,087 |
| 2024 | $3,008 | $249,354 | $91,425 | $157,929 |
| 2023 | $2,940 | $244,466 | $89,633 | $154,833 |
| 2022 | $2,861 | $239,674 | $87,876 | $151,798 |
| 2021 | $2,839 | $234,975 | $86,153 | $148,822 |
| 2020 | $2,804 | $232,567 | $85,270 | $147,297 |
| 2019 | $2,753 | $228,008 | $83,599 | $144,409 |
| 2018 | $2,574 | $223,538 | $81,960 | $141,578 |
| 2017 | $2,511 | $219,155 | $80,353 | $138,802 |
| 2016 | $2,469 | $214,859 | $78,778 | $136,081 |
| 2015 | $2,432 | $211,632 | $77,595 | $134,037 |
| 2014 | $2,392 | $207,488 | $76,076 | $131,412 |
Source: Public Records
Map
Nearby Homes
- 7855 Hummingbird Ln
- 2772 Meadow Lark Dr
- 7813 Starling Dr
- 7830 Nightingale Way
- 2660 Pheasant Dr
- 8441 Encino Ave
- 2376 Ron Way
- 7613 Family Cir Unit LU5
- 7555 Linda Vista Unit 9
- 8627 Anrol Ave
- 7462 Hanford Place
- 2290 Hanford Dr
- 2130 Cardinal Dr
- 2767 Lancha St
- 7625 Teebird Ln
- 7128 E Hyatt St
- 2045 Cardinal Dr
- 7485 Gateshead St
- 8355 Summit Way
- 5806 Mission Center Rd Unit F
- 7754 Nightingale Way
- 7746 Nightingale Way
- 7744 Nightingale Way
- 7740 Nightingale Way Unit 86
- 7738 Nightingale Way
- 7819 Hummingbird Ln
- 7831 Hummingbird Ln
- 7835 Hummingbird Ln
- 7839 Hummingbird Ln
- 2722 Meadow Lark Dr
- 2724 Meadow Lark Dr
- 7702 Nightingale Way
- 7750 Nightingale Way
- 7755 Starling Dr
- 7742 Nightingale Way Unit 87
- 7734 Nightingale Way
- 7730 Nightingale Way
- 7728 Nightingale Way
- 7726 Nightingale Way Unit 79
- 7823 Hummingbird Ln