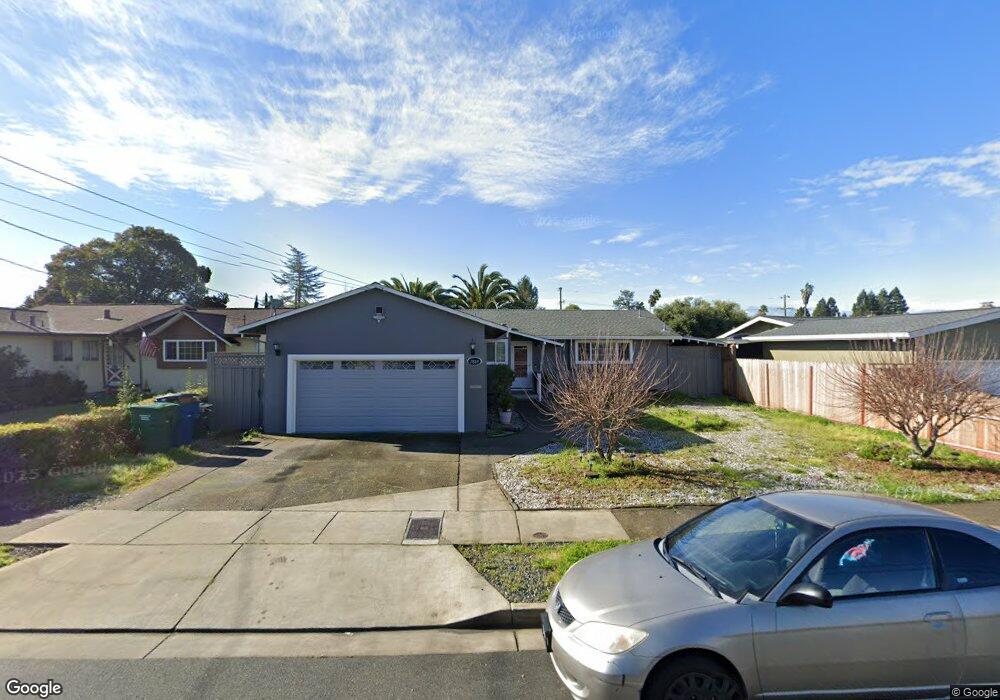
7849 Adrian Dr Rohnert Park, CA 94928
Estimated Value: $575,918 - $647,000
3
Beds
2
Baths
1,093
Sq Ft
$562/Sq Ft
Est. Value
About This Home
This home is located at 7849 Adrian Dr, Rohnert Park, CA 94928 and is currently estimated at $613,730, approximately $561 per square foot. 7849 Adrian Dr is a home located in Sonoma County with nearby schools including Rancho Cotate High School, Cross & Crown Lutheran School, and Bridghaven.
Ownership History
Date
Name
Owned For
Owner Type
Purchase Details
Closed on
Aug 16, 2019
Sold by
Nguyen Chinh N
Bought by
Nguyen Chinh N and Nguyen Mui T
Current Estimated Value
Purchase Details
Closed on
Aug 9, 2011
Sold by
Owb Reo Llc
Bought by
Nguyen Chinh N
Home Financials for this Owner
Home Financials are based on the most recent Mortgage that was taken out on this home.
Original Mortgage
$92,000
Interest Rate
4.09%
Mortgage Type
New Conventional
Purchase Details
Closed on
Jan 23, 2011
Sold by
Billings Andrea
Bought by
Owb Reo Llc
Purchase Details
Closed on
Aug 25, 2003
Sold by
Billings Andrea and Novelly Andrea
Bought by
Billings Andrea
Purchase Details
Closed on
Jun 17, 1998
Sold by
Brisbine Homer and Brisbine Kathleen
Bought by
Billings Gregory and Novelly Andrea
Home Financials for this Owner
Home Financials are based on the most recent Mortgage that was taken out on this home.
Original Mortgage
$141,950
Interest Rate
9.99%
Create a Home Valuation Report for This Property
The Home Valuation Report is an in-depth analysis detailing your home's value as well as a comparison with similar homes in the area
Home Values in the Area
Average Home Value in this Area
Purchase History
| Date | Buyer | Sale Price | Title Company |
|---|---|---|---|
| Nguyen Chinh N | -- | None Available | |
| Nguyen Chinh N | $162,500 | Lsi Title Company | |
| Owb Reo Llc | $218,117 | Accommodation | |
| Billings Andrea | -- | First American Title Co | |
| Billings Andrea | -- | First American Title Co | |
| Billings Gregory | $167,000 | First American Title |
Source: Public Records
Mortgage History
| Date | Status | Borrower | Loan Amount |
|---|---|---|---|
| Previous Owner | Nguyen Chinh N | $92,000 | |
| Previous Owner | Billings Gregory | $141,950 |
Source: Public Records
Tax History Compared to Growth
Tax History
| Year | Tax Paid | Tax Assessment Tax Assessment Total Assessment is a certain percentage of the fair market value that is determined by local assessors to be the total taxable value of land and additions on the property. | Land | Improvement |
|---|---|---|---|---|
| 2025 | $2,423 | $204,097 | $125,599 | $78,498 |
| 2024 | $2,423 | $200,096 | $123,137 | $76,959 |
| 2023 | $2,423 | $196,173 | $120,723 | $75,450 |
| 2022 | $2,375 | $192,327 | $118,356 | $73,971 |
| 2021 | $2,356 | $188,557 | $116,036 | $72,521 |
| 2020 | $2,389 | $186,625 | $114,847 | $71,778 |
| 2019 | $2,359 | $182,967 | $112,596 | $70,371 |
| 2018 | $2,314 | $179,381 | $110,389 | $68,992 |
| 2017 | $2,276 | $175,865 | $108,225 | $67,640 |
| 2016 | $2,178 | $172,417 | $106,103 | $66,314 |
| 2015 | $2,126 | $169,828 | $104,510 | $65,318 |
| 2014 | $2,112 | $166,502 | $102,463 | $64,039 |
Source: Public Records
Map
Nearby Homes
- 368 Bonnie Ct
- 8034 Adrian Dr
- 359 Bonnie Ave
- 7530 Bernice Ave
- 461 Lincoln Ave
- 7449 Adrian Dr
- 293 Lincoln Ave
- 746 Bernadette Ave
- 8440 Lasalle Ave
- 8140 Sunflower Dr
- 8175 Arthur St
- 219 College View Dr
- 8484 Lancaster Dr
- 7006 Santero Way
- 76 Creek Ct Unit 76
- 8006 Manor Ct
- 105 Nicholas Ct
- 7103 Camino Colegio Unit 55
- 11 Ramble Creek Dr
- 1217 Mateo Dr
- 7831 Adrian Dr
- 7863 Adrian Dr
- 7815 Adrian Dr
- 7877 Adrian Dr
- 7792 Blair Ave
- 7828 Blair Ave
- 7850 Adrian Dr
- 7834 Adrian Dr
- 7850 Blair Ave
- 7864 Adrian Dr
- 7772 Blair Ave
- 7787 Adrian Dr
- 7893 Adrian Dr
- 7818 Adrian Dr
- 7878 Adrian Dr
- 7802 Adrian Dr
- 7892 Adrian Dr
- 7899 Adrian Dr
- 7795 Santa Barbara Dr
- 443 Bonnie Ave