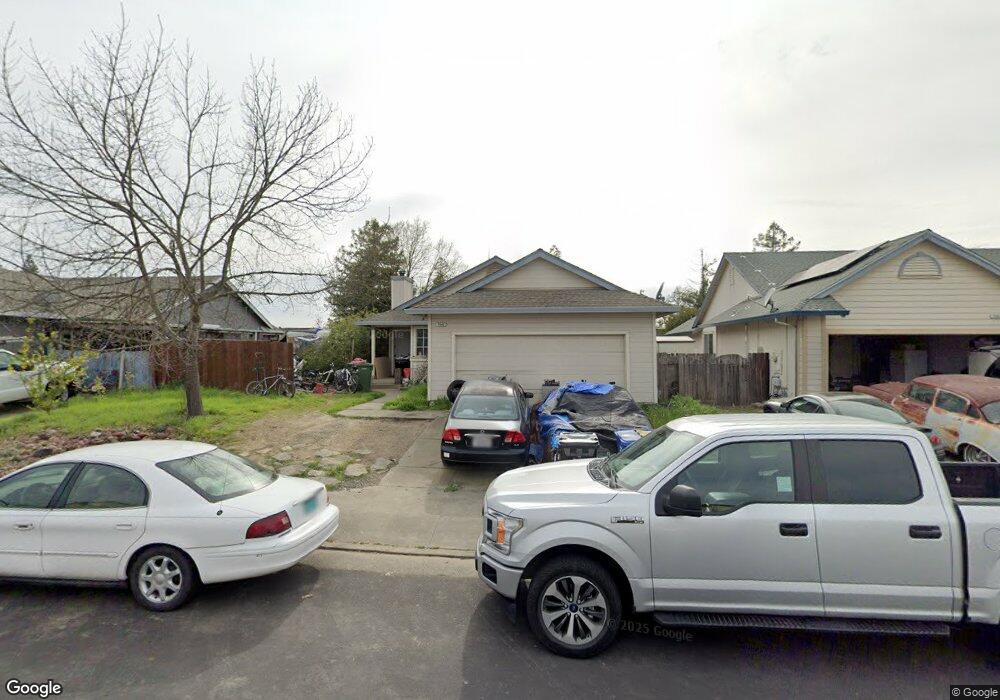
7849 Dove Ln Windsor, CA 95492
Estimated Value: $574,000 - $768,000
3
Beds
2
Baths
1,090
Sq Ft
$607/Sq Ft
Est. Value
About This Home
This home is located at 7849 Dove Ln, Windsor, CA 95492 and is currently estimated at $661,180, approximately $606 per square foot. 7849 Dove Ln is a home located in Sonoma County with nearby schools including Mattie Washburn Elementary School, Brooks Elementary School, and Windsor Middle School.
Ownership History
Date
Name
Owned For
Owner Type
Purchase Details
Closed on
Oct 2, 2024
Sold by
Gould Bruce F and Meiklejohn Lauren M
Bought by
Gould-Meiklejohn Revocable Trust and Gould
Current Estimated Value
Purchase Details
Closed on
Apr 27, 1999
Sold by
Nowrouzi Kaveh S and Nowrouzi Christina R
Bought by
Crenshaw Randall and Crenshaw Alma
Home Financials for this Owner
Home Financials are based on the most recent Mortgage that was taken out on this home.
Original Mortgage
$179,450
Interest Rate
6.98%
Purchase Details
Closed on
Sep 11, 1996
Sold by
Meadow Wood Investors
Bought by
Nowrouzi Kaveh S and Nowrouzi Christina R
Home Financials for this Owner
Home Financials are based on the most recent Mortgage that was taken out on this home.
Original Mortgage
$156,902
Interest Rate
8.23%
Mortgage Type
FHA
Create a Home Valuation Report for This Property
The Home Valuation Report is an in-depth analysis detailing your home's value as well as a comparison with similar homes in the area
Home Values in the Area
Average Home Value in this Area
Purchase History
| Date | Buyer | Sale Price | Title Company |
|---|---|---|---|
| Gould-Meiklejohn Revocable Trust | -- | None Listed On Document | |
| Crenshaw Randall | $185,000 | Fidelity National Title Co | |
| Nowrouzi Kaveh S | $160,000 | Northwestern Title Security |
Source: Public Records
Mortgage History
| Date | Status | Borrower | Loan Amount |
|---|---|---|---|
| Previous Owner | Crenshaw Randall | $179,450 | |
| Previous Owner | Nowrouzi Kaveh S | $156,902 |
Source: Public Records
Tax History
| Year | Tax Paid | Tax Assessment Tax Assessment Total Assessment is a certain percentage of the fair market value that is determined by local assessors to be the total taxable value of land and additions on the property. | Land | Improvement |
|---|---|---|---|---|
| 2025 | $3,560 | $290,011 | $114,433 | $175,578 |
| 2024 | $3,560 | $284,326 | $112,190 | $172,136 |
| 2023 | $3,560 | $278,752 | $109,991 | $168,761 |
| 2022 | $3,435 | $273,287 | $107,835 | $165,452 |
| 2021 | $3,382 | $267,929 | $105,721 | $162,208 |
| 2020 | $3,452 | $265,182 | $104,637 | $160,545 |
| 2019 | $3,446 | $259,984 | $102,586 | $157,398 |
| 2018 | $3,398 | $254,887 | $100,575 | $154,312 |
| 2017 | $3,366 | $249,890 | $98,603 | $151,287 |
| 2016 | $3,167 | $244,991 | $96,670 | $148,321 |
| 2015 | $3,083 | $241,312 | $95,218 | $146,094 |
| 2014 | $3,037 | $236,586 | $93,353 | $143,233 |
Source: Public Records
Map
Nearby Homes
Your Personal Tour Guide
Ask me questions while you tour the home.