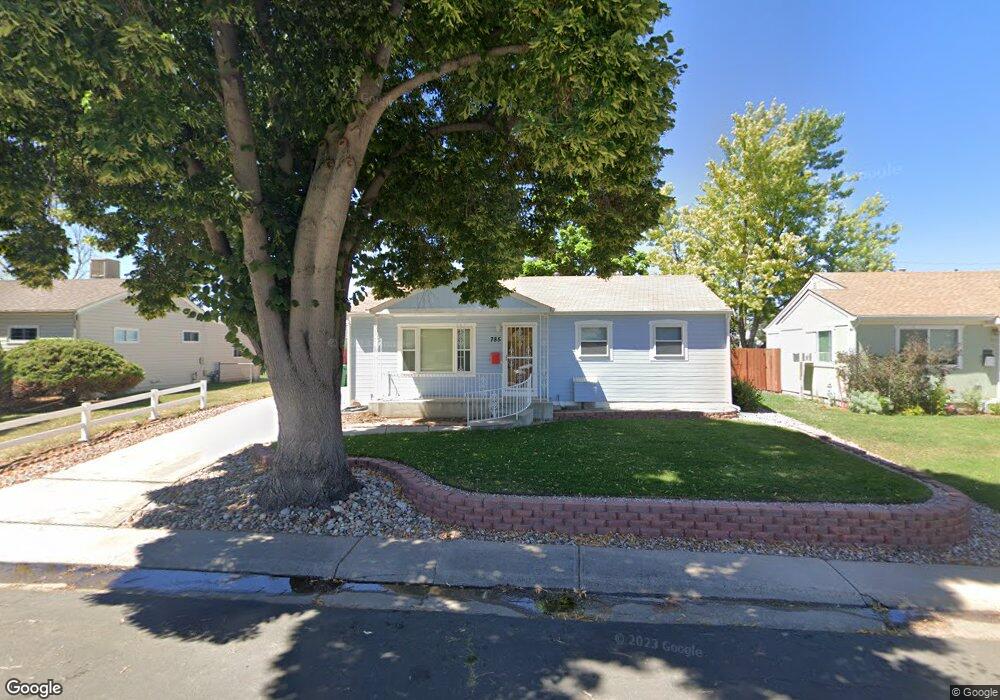
785 Kenton St Aurora, CO 80010
Del Mar Parkway NeighborhoodEstimated Value: $367,213 - $393,000
3
Beds
1
Bath
936
Sq Ft
$404/Sq Ft
Est. Value
About This Home
This home is located at 785 Kenton St, Aurora, CO 80010 and is currently estimated at $378,553, approximately $404 per square foot. 785 Kenton St is a home located in Arapahoe County with nearby schools including Fulton Elementary School, Lincoln Elementary School, and Del Mar Academy.
Ownership History
Date
Name
Owned For
Owner Type
Purchase Details
Closed on
Apr 11, 1991
Sold by
Moore James A Trust
Bought by
Wallachy Robert
Current Estimated Value
Purchase Details
Closed on
Dec 23, 1990
Sold by
Moore James A and Moore Dorothy G
Bought by
Moore Dorothy G Moore Ronald W
Purchase Details
Closed on
Dec 26, 1989
Sold by
Moore James A and Moore Dorothy G
Bought by
Moore James A and Moore Dorothy G
Purchase Details
Closed on
Dec 21, 1987
Sold by
Conversion Arapco
Bought by
Moore James A and Moore Dorothy G
Purchase Details
Closed on
Jul 4, 1776
Bought by
Conversion Arapco
Create a Home Valuation Report for This Property
The Home Valuation Report is an in-depth analysis detailing your home's value as well as a comparison with similar homes in the area
Home Values in the Area
Average Home Value in this Area
Purchase History
| Date | Buyer | Sale Price | Title Company |
|---|---|---|---|
| Wallachy Robert | -- | -- | |
| Moore James A Trust | -- | -- | |
| Moore Dorothy G Moore Ronald W | -- | -- | |
| Moore James A | -- | -- | |
| Moore James A | -- | -- | |
| Conversion Arapco | -- | -- |
Source: Public Records
Tax History Compared to Growth
Tax History
| Year | Tax Paid | Tax Assessment Tax Assessment Total Assessment is a certain percentage of the fair market value that is determined by local assessors to be the total taxable value of land and additions on the property. | Land | Improvement |
|---|---|---|---|---|
| 2024 | $2,083 | $22,412 | -- | -- |
| 2023 | $2,083 | $22,412 | $0 | $0 |
| 2022 | $1,747 | $17,403 | $0 | $0 |
| 2021 | $1,804 | $17,403 | $0 | $0 |
| 2020 | $1,612 | $15,480 | $0 | $0 |
| 2019 | $1,603 | $15,480 | $0 | $0 |
| 2018 | $1,452 | $13,730 | $0 | $0 |
| 2017 | $1,263 | $13,730 | $0 | $0 |
| 2016 | $956 | $10,181 | $0 | $0 |
| 2015 | $923 | $10,181 | $0 | $0 |
| 2014 | -- | $6,169 | $0 | $0 |
| 2013 | -- | $6,000 | $0 | $0 |
Source: Public Records
Map
Nearby Homes
- 770 Kenton St
- 775 Joliet St
- 775 Lansing St
- 812 Lansing St
- 820 Lansing St
- 865 Lansing St
- 10595 E Lowry Place
- 860 Lansing St
- 10633 E 6th Place
- 885 Ironton St
- 765 Moline St
- 845 Macon St
- 574 Iola St
- 995 Ironton St
- 740 Moline St
- 1041 Kingston St
- 472 Jamaica St
- 11612 Del Mar Pkwy
- 911 Hanover St
- 855 Newark St