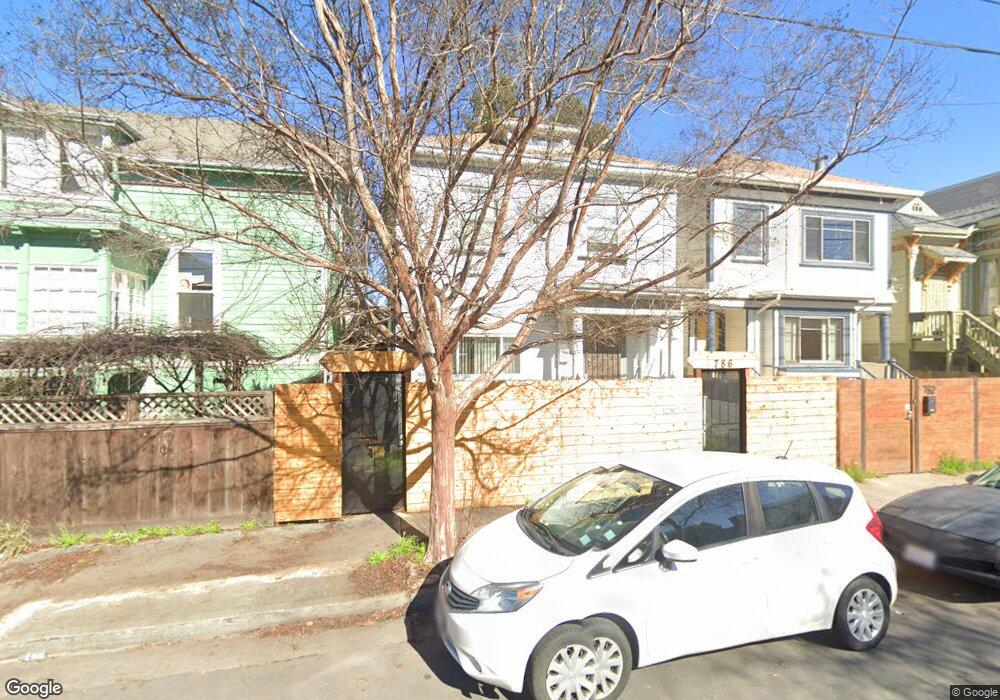
786 20th St Oakland, CA 94612
West Oakland NeighborhoodEstimated Value: $617,000 - $807,000
5
Beds
2
Baths
--
Sq Ft
1,394
Sq Ft
About This Home
This home is located at 786 20th St, Oakland, CA 94612 and is currently estimated at $685,749. 786 20th St is a home located in Alameda County with nearby schools including M. L. King Jr. Elementary School, West Oakland Middle School, and McClymonds High School.
Ownership History
Date
Name
Owned For
Owner Type
Purchase Details
Closed on
Feb 28, 2011
Sold by
Deutsche Bank Trust Company Americas
Bought by
Reo Homes 2 Llc
Current Estimated Value
Purchase Details
Closed on
Jan 11, 2011
Sold by
Robinson Jerry D
Bought by
Deutsche Bank Trust Company Americas
Purchase Details
Closed on
Feb 9, 1999
Sold by
Young Wilson and Young Imelda
Bought by
Robinson Jerry D
Home Financials for this Owner
Home Financials are based on the most recent Mortgage that was taken out on this home.
Original Mortgage
$137,863
Interest Rate
6.79%
Mortgage Type
FHA
Purchase Details
Closed on
May 26, 1997
Sold by
Wong Sam Y
Bought by
Young Wilson and Young Imelda
Purchase Details
Closed on
Jul 26, 1996
Sold by
Young Wilson and Young Imelda
Bought by
Wong Sam Y
Home Financials for this Owner
Home Financials are based on the most recent Mortgage that was taken out on this home.
Original Mortgage
$77,000
Interest Rate
8.32%
Create a Home Valuation Report for This Property
The Home Valuation Report is an in-depth analysis detailing your home's value as well as a comparison with similar homes in the area
Home Values in the Area
Average Home Value in this Area
Purchase History
| Date | Buyer | Sale Price | Title Company |
|---|---|---|---|
| Reo Homes 2 Llc | $175,000 | Chicago Title Company | |
| Deutsche Bank Trust Company Americas | $184,800 | Accommodation | |
| Robinson Jerry D | $141,000 | Old Republic Title Company | |
| Young Wilson | -- | -- | |
| Wong Sam Y | $110,000 | First American Title Guarant | |
| Leung Ho Yim | -- | First American Title Guarant |
Source: Public Records
Mortgage History
| Date | Status | Borrower | Loan Amount |
|---|---|---|---|
| Previous Owner | Robinson Jerry D | $137,863 | |
| Previous Owner | Wong Sam Y | $77,000 |
Source: Public Records
Tax History
| Year | Tax Paid | Tax Assessment Tax Assessment Total Assessment is a certain percentage of the fair market value that is determined by local assessors to be the total taxable value of land and additions on the property. | Land | Improvement |
|---|---|---|---|---|
| 2025 | $5,125 | $224,191 | $67,257 | $156,934 |
| 2024 | $5,125 | $219,797 | $65,939 | $153,858 |
| 2023 | $5,243 | $215,488 | $64,646 | $150,842 |
| 2022 | $4,976 | $211,264 | $63,379 | $147,885 |
| 2021 | $4,570 | $207,122 | $62,136 | $144,986 |
| 2020 | $4,516 | $205,000 | $61,500 | $143,500 |
| 2019 | $4,226 | $200,981 | $60,294 | $140,687 |
| 2018 | $4,142 | $197,042 | $59,112 | $137,930 |
| 2017 | $3,936 | $193,180 | $57,954 | $135,226 |
| 2016 | $3,740 | $189,393 | $56,818 | $132,575 |
| 2015 | $3,717 | $186,550 | $55,965 | $130,585 |
| 2014 | $3,762 | $182,895 | $54,868 | $128,027 |
Source: Public Records
Map
Nearby Homes
Your Personal Tour Guide
Ask me questions while you tour the home.