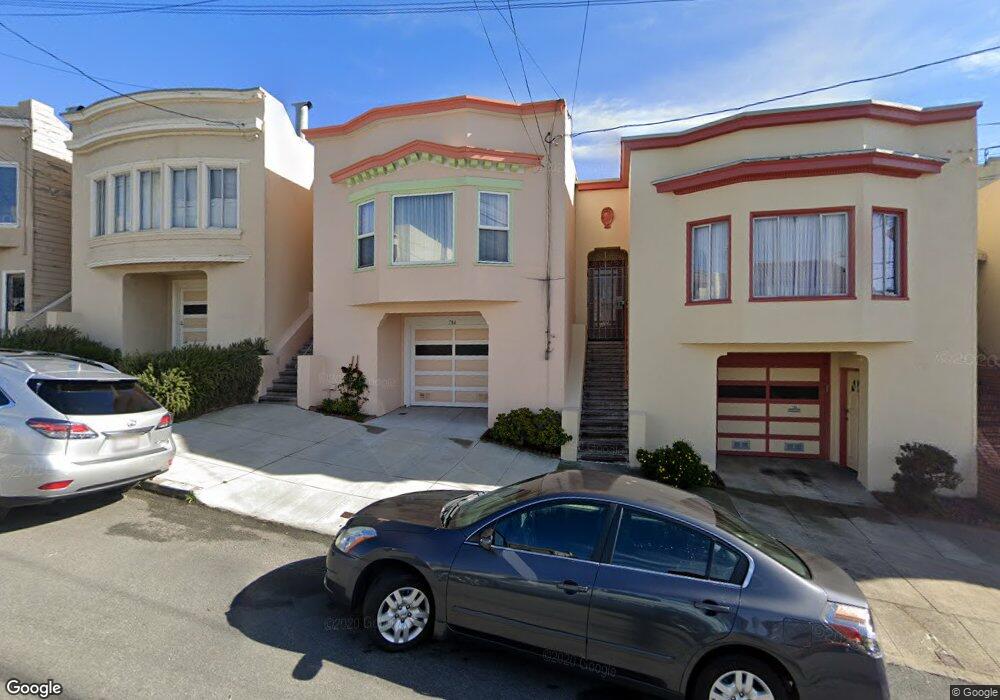
786 39th Ave San Francisco, CA 94121
Outer Richmond NeighborhoodEstimated Value: $1,535,000 - $1,784,000
3
Beds
2
Baths
1,645
Sq Ft
$988/Sq Ft
Est. Value
About This Home
This home is located at 786 39th Ave, San Francisco, CA 94121 and is currently estimated at $1,625,435, approximately $988 per square foot. 786 39th Ave is a home located in San Francisco County with nearby schools including Lafayette Elementary School, Presidio Middle School, and St. Thomas The Apostle School.
Ownership History
Date
Name
Owned For
Owner Type
Purchase Details
Closed on
Sep 28, 1998
Sold by
Eagen Aileen S Intervivos Trust and Cowan Mollyanne
Bought by
Liang Kenneth Zi Qian and Liang Wanda Lin
Current Estimated Value
Home Financials for this Owner
Home Financials are based on the most recent Mortgage that was taken out on this home.
Original Mortgage
$200,000
Outstanding Balance
$43,713
Interest Rate
6.88%
Estimated Equity
$1,581,723
Create a Home Valuation Report for This Property
The Home Valuation Report is an in-depth analysis detailing your home's value as well as a comparison with similar homes in the area
Home Values in the Area
Average Home Value in this Area
Purchase History
| Date | Buyer | Sale Price | Title Company |
|---|---|---|---|
| Liang Kenneth Zi Qian | $250,000 | Old Republic Title Company |
Source: Public Records
Mortgage History
| Date | Status | Borrower | Loan Amount |
|---|---|---|---|
| Open | Liang Kenneth Zi Qian | $200,000 |
Source: Public Records
Tax History Compared to Growth
Tax History
| Year | Tax Paid | Tax Assessment Tax Assessment Total Assessment is a certain percentage of the fair market value that is determined by local assessors to be the total taxable value of land and additions on the property. | Land | Improvement |
|---|---|---|---|---|
| 2025 | $5,754 | $498,493 | $313,534 | $184,959 |
| 2024 | $5,754 | $488,721 | $307,387 | $181,334 |
| 2023 | $5,671 | $479,140 | $301,360 | $177,780 |
| 2022 | $5,570 | $469,746 | $295,451 | $174,295 |
| 2021 | $5,474 | $460,536 | $289,658 | $170,878 |
| 2020 | $5,490 | $455,815 | $286,688 | $169,127 |
| 2019 | $5,302 | $446,879 | $281,067 | $165,812 |
| 2018 | $5,125 | $438,118 | $275,556 | $162,562 |
| 2017 | $5,064 | $429,528 | $270,153 | $159,375 |
| 2016 | $5,235 | $421,107 | $264,856 | $156,251 |
| 2015 | $5,168 | $414,783 | $260,878 | $153,905 |
| 2014 | $5,031 | $406,659 | $255,768 | $150,891 |
Source: Public Records
Map
Nearby Homes