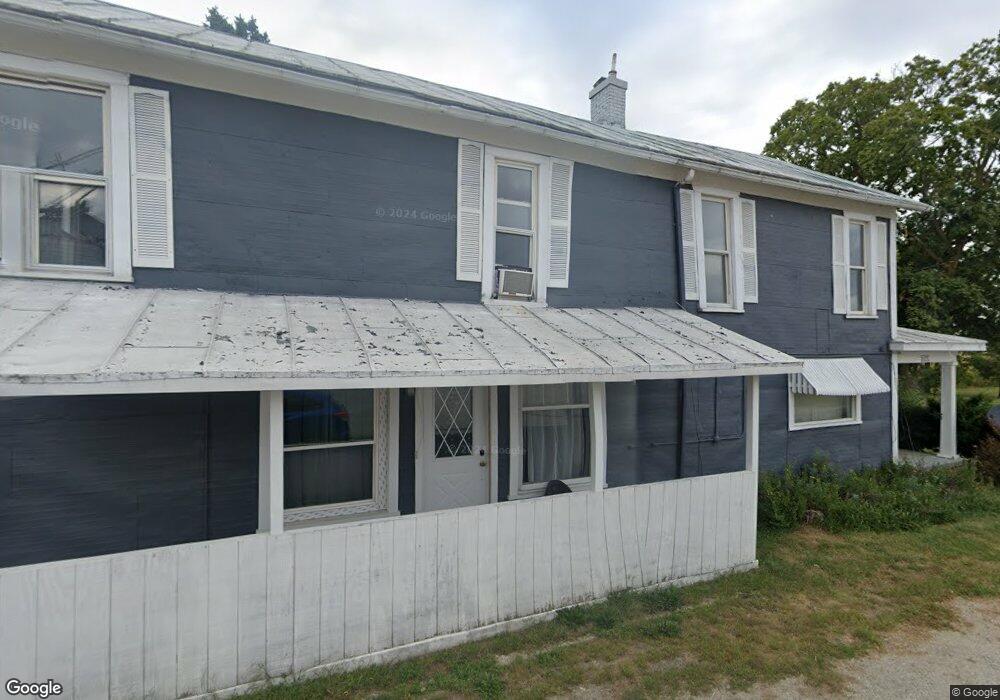
786 E 500 S Winchester, IN 47394
Estimated Value: $115,513 - $289,000
4
Beds
1
Bath
4,052
Sq Ft
$46/Sq Ft
Est. Value
About This Home
This home is located at 786 E 500 S, Winchester, IN 47394 and is currently estimated at $186,378, approximately $45 per square foot. 786 E 500 S is a home located in Randolph County with nearby schools including Randolph Southern Elementary School and Randolph Southern Junior/Senior High School.
Ownership History
Date
Name
Owned For
Owner Type
Purchase Details
Closed on
May 24, 2023
Sold by
Allen Cnty Board/Commissioner
Bought by
Diaz Abelardo Chavez
Current Estimated Value
Purchase Details
Closed on
Feb 13, 2023
Sold by
Murray Audrey E
Bought by
Garcia Juana
Purchase Details
Closed on
Sep 1, 2011
Sold by
Murray Leland K and Murray Audrey E
Bought by
Garcia Juana
Create a Home Valuation Report for This Property
The Home Valuation Report is an in-depth analysis detailing your home's value as well as a comparison with similar homes in the area
Purchase History
| Date | Buyer | Sale Price | Title Company |
|---|---|---|---|
| Diaz Abelardo Chavez | -- | None Listed On Document | |
| Garcia Juana | -- | None Listed On Document | |
| Garcia Juana | $70,000 | None Available |
Source: Public Records
Mortgage History
| Date | Status | Borrower | Loan Amount |
|---|---|---|---|
| Closed | Garcia Juana | $0 |
Source: Public Records
Tax History
| Year | Tax Paid | Tax Assessment Tax Assessment Total Assessment is a certain percentage of the fair market value that is determined by local assessors to be the total taxable value of land and additions on the property. | Land | Improvement |
|---|---|---|---|---|
| 2025 | $1,182 | $97,200 | $9,000 | $88,200 |
| 2024 | $1,182 | $92,600 | $8,700 | $83,900 |
| 2023 | $385 | $95,100 | $8,700 | $86,400 |
| 2022 | $512 | $93,500 | $8,700 | $84,800 |
| 2021 | $322 | $66,500 | $12,900 | $53,600 |
| 2020 | $286 | $59,300 | $11,300 | $48,000 |
| 2019 | $255 | $57,900 | $11,300 | $46,600 |
| 2018 | $233 | $54,400 | $10,700 | $43,700 |
| 2017 | $217 | $54,600 | $10,700 | $43,900 |
| 2016 | $206 | $52,200 | $9,700 | $42,500 |
| 2014 | $168 | $50,300 | $9,700 | $40,600 |
| 2013 | $168 | $48,900 | $9,700 | $39,200 |
Source: Public Records
Map
Nearby Homes
- 703 Westwood Dr
- 112 N Garfield St
- 2212 E Greenville Pike
- 1041 S Huntsville Rd
- 1027 S Huntsville Rd
- 1033 S Huntsville Rd
- Lot 5 Huntsville Rd
- 889 S Huntsville Rd
- 810 S Elm Blvd
- 114 E Orange St
- 603 S Stone St
- 4 Crestwood Dr
- 315 W Orange St
- 504 S Meridian St
- 401 W George St
- 404 E Thompson St
- 407 Westwood Dr
- 527 W South St
- 230 W South St
- 622 W South St
Your Personal Tour Guide
Ask me questions while you tour the home.