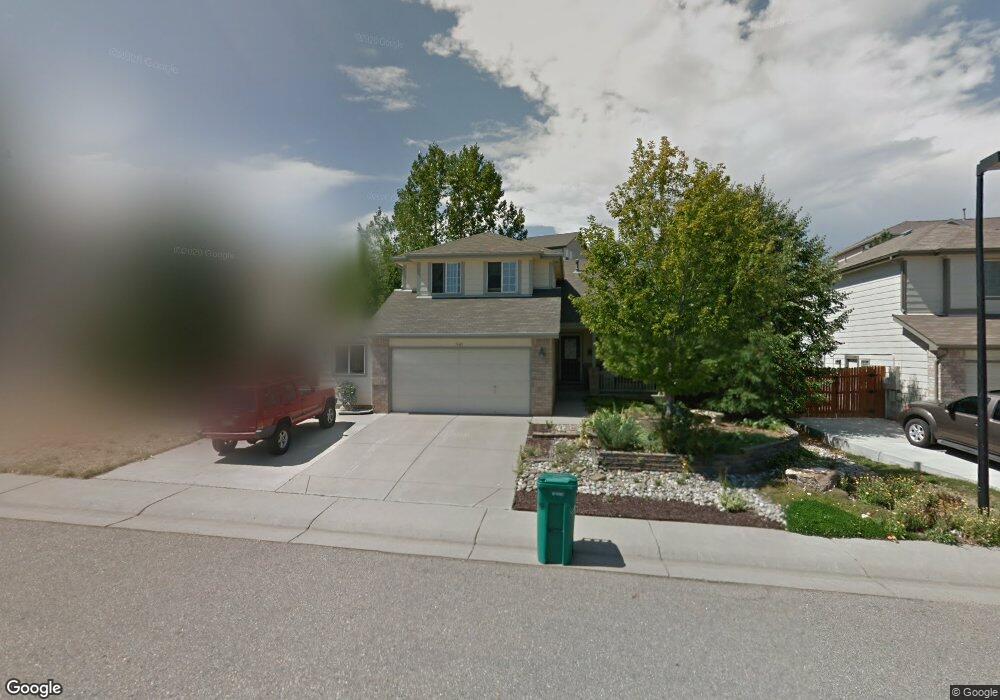
7865 Canvasback Cir Littleton, CO 80125
Estimated Value: $585,000 - $633,000
4
Beds
3
Baths
2,074
Sq Ft
$291/Sq Ft
Est. Value
About This Home
This home is located at 7865 Canvasback Cir, Littleton, CO 80125 and is currently estimated at $603,473, approximately $290 per square foot. 7865 Canvasback Cir is a home located in Douglas County with nearby schools including Roxborough Elementary School, Roxborough Intermediate School, and Ranch View Middle School.
Ownership History
Date
Name
Owned For
Owner Type
Purchase Details
Closed on
Jul 31, 1997
Sold by
Advantage Design Build Inc
Bought by
Daleigh Cynthia J
Current Estimated Value
Home Financials for this Owner
Home Financials are based on the most recent Mortgage that was taken out on this home.
Original Mortgage
$151,534
Outstanding Balance
$22,833
Interest Rate
7.6%
Mortgage Type
FHA
Estimated Equity
$580,640
Purchase Details
Closed on
Jul 23, 1997
Sold by
Advantage Design Build Inc
Bought by
Daleigh Cynthia J
Home Financials for this Owner
Home Financials are based on the most recent Mortgage that was taken out on this home.
Original Mortgage
$151,534
Outstanding Balance
$22,833
Interest Rate
7.6%
Mortgage Type
FHA
Estimated Equity
$580,640
Purchase Details
Closed on
Nov 25, 1996
Sold by
Roxborough Acquisition Corp
Bought by
Advantage Design Build Inc
Home Financials for this Owner
Home Financials are based on the most recent Mortgage that was taken out on this home.
Original Mortgage
$248,781
Interest Rate
9.75%
Mortgage Type
Unknown
Create a Home Valuation Report for This Property
The Home Valuation Report is an in-depth analysis detailing your home's value as well as a comparison with similar homes in the area
Home Values in the Area
Average Home Value in this Area
Purchase History
| Date | Buyer | Sale Price | Title Company |
|---|---|---|---|
| Daleigh Cynthia J | $157,200 | Land Title | |
| Daleigh Cynthia J | $157,200 | -- | |
| Advantage Design Build Inc | $24,215 | Land Title |
Source: Public Records
Mortgage History
| Date | Status | Borrower | Loan Amount |
|---|---|---|---|
| Open | Daleigh Cynthia J | $151,534 | |
| Previous Owner | Advantage Design Build Inc | $248,781 |
Source: Public Records
Tax History Compared to Growth
Tax History
| Year | Tax Paid | Tax Assessment Tax Assessment Total Assessment is a certain percentage of the fair market value that is determined by local assessors to be the total taxable value of land and additions on the property. | Land | Improvement |
|---|---|---|---|---|
| 2024 | $3,812 | $40,160 | $7,120 | $33,040 |
| 2023 | $3,838 | $40,160 | $7,120 | $33,040 |
| 2022 | $2,962 | $28,310 | $5,260 | $23,050 |
| 2021 | $3,095 | $28,310 | $5,260 | $23,050 |
| 2020 | $3,166 | $27,310 | $5,880 | $21,430 |
| 2019 | $3,216 | $27,310 | $5,880 | $21,430 |
| 2018 | $3,494 | $24,230 | $4,330 | $19,900 |
| 2017 | $3,357 | $24,230 | $4,330 | $19,900 |
| 2016 | $2,966 | $21,140 | $3,980 | $17,160 |
| 2015 | $3,064 | $21,140 | $3,980 | $17,160 |
| 2014 | $2,803 | $17,990 | $3,580 | $14,410 |
Source: Public Records
Map
Nearby Homes
- 10329 Halleys Way
- 7961 Jared Way
- 7719 Jared Way
- 7627 Halleys Dr
- 7582 Jared Way
- 10441 Beech St
- 7832 Elmwood St
- 7681 Crystal Lake Ct
- 7217 Red Mesa Ct
- 7597 Bison Ct
- 7191 Red Mesa Dr
- 7572 Raphael Ln
- 9898 Monte Vista Ave
- 7536 Raphael Ln
- 7680 Elmwood St
- 7893 Raphael Ln
- 10594 Wildhorse Ln
- 7911 Raphael Ln
- 8275 Hunts Peak St
- 8000 Raphael Ln
- 7859 Canvasback Cir
- 7869 Canvasback Cir
- 7819 Canvasback Cir
- 7873 Canvasback Cir
- 7823 Canvasback Cir
- 7855 Canvasback Cir
- 7815 Canvasback Cir
- 7866 Canvasback Cir
- 7862 Canvasback Cir
- 7827 Canvasback Cir
- 7870 Canvasback Cir
- 7877 Canvasback Cir
- 7858 Canvasback Cir
- 7811 Canvasback Cir
- 7874 Canvasback Cir
- 7854 Canvasback Cir
- 7881 Canvasback Cir
- 7809 Canvasback Cir
- 7878 Canvasback Cir
- 7836 Canvasback Cir